

Comparing sound localization deficits in bilateral cochlear-implant users and vocoder simulations with normal-hearing listeners
- PMID: 25385244
- PMCID: PMC4271768
- DOI: 10.1177/2331216514554574
Comparing sound localization deficits in bilateral cochlear-implant users and vocoder simulations with normal-hearing listeners
Abstract
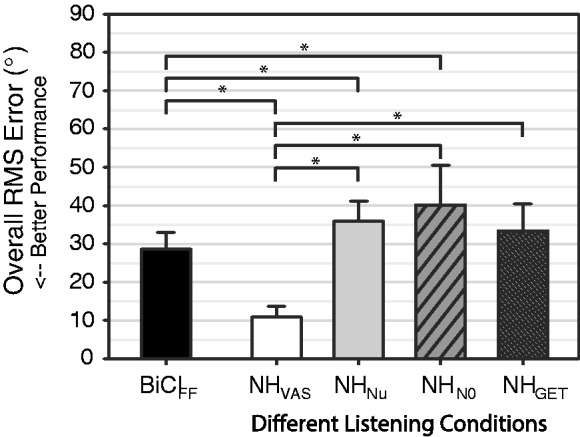
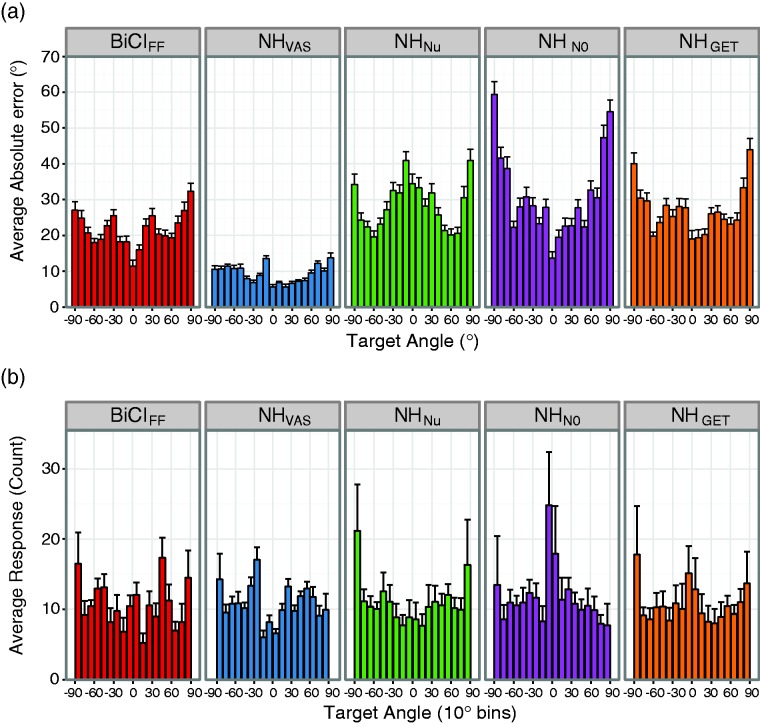
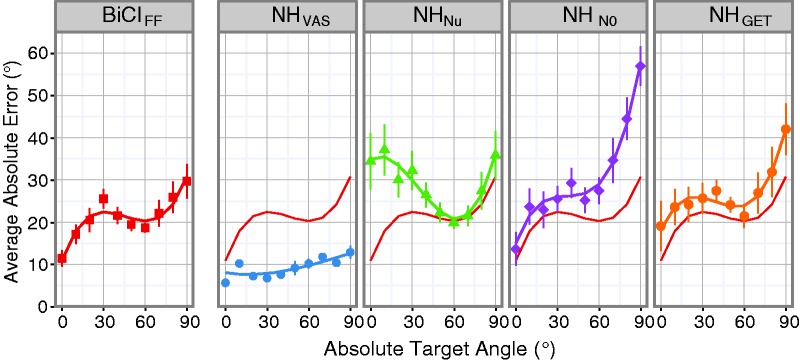
Bilateral cochlear-implant (BiCI) users are less accurate at localizing free-field (FF) sound sources than normal-hearing (NH) listeners. This performance gap is not well understood but is likely due to a combination of compromises in acoustic signal representation by the two independent speech processors and neural degradation of auditory pathways associated with a patient's hearing loss. To exclusively investigate the effect of CI speech encoding on horizontal-plane sound localization, the present study measured sound localization performance in NH subjects listening to vocoder processed and nonvocoded virtual acoustic space (VAS) stimuli. Various aspects of BiCI stimulation such as independently functioning devices, variable across-ear channel selection, and pulsatile stimulation were simulated using uncorrelated noise (Nu), correlated noise (N0), or Gaussian-enveloped tone (GET) carriers during vocoder processing. Additionally, FF sound localization in BiCI users was measured in the same testing environment for comparison. Distinct response patterns across azimuthal locations were evident for both listener groups and were analyzed using a multilevel regression analysis. Simulated implant speech encoding, regardless of carrier, was detrimental to NH localization and the GET vocoder best simulated BiCI FF performance in NH listeners. Overall, the detrimental effect of vocoder processing on NH performance suggests that sound localization deficits may persist even for BiCI patients who have minimal neural degradation associated with their hearing loss and indicates that CI speech encoding plays a significant role in the sound localization deficits experienced by BiCI users.
Keywords: bilateral; cochlear implant; sound localization; vocoder.
© The Author(s) 2014.
Figures
References
-
- Bernstein L. R., Trahiotis C. (1985) Lateralization of sinusoidally amplitude-modulated tones: Effects of spectral locus and temporal variation. The Journal of the Acoustical Society of America 78(2): 514–523. - PubMed
-
- Bernstein L. R., Trahiotis C. (1992) Discrimination of interaural envelope correlation and its relation to binaural unmasking at high frequencies. The Journal of the Acoustical Society of America 91(1): 306–316. - PubMed
-
- Bernstein L. R., Trahiotis C. (1996) On the use of the normalized correlation as an index of interaural envelope correlation. The Journal of the Acoustical Society of America 100(3): 1754–1763. - PubMed
-
- Bernstein L. R., Trahiotis C. (1997) The effects of randomizing values of interaural disparities on binaural detection and on discrimination of interaural correlation. The Journal of the Acoustical Society of America 102(2 Pt. 1): 1113–1120. - PubMed
-
- Bernstein L. R., Trahiotis C. (2002) Enhancing sensitivity to interaural delays at high frequencies by using “transposed stimuli”. The Journal of the Acoustical Society of America 112(3 Pt. 1): 1026–1036. - PubMed
Publication types
MeSH terms
Grants and funding
LinkOut - more resources
Full Text Sources
Other Literature Sources
Medical
Research Materials
Miscellaneous
