. 2014 Nov 11:5:5209.
doi: 10.1038/ncomms6209.

Structural basis for extracellular cis and trans RPTPσ signal competition in synaptogenesis

Affiliations

Structural basis for extracellular cis and trans RPTPσ signal competition in synaptogenesis

Charlotte H Coles et al. Nat Commun. .

Abstract

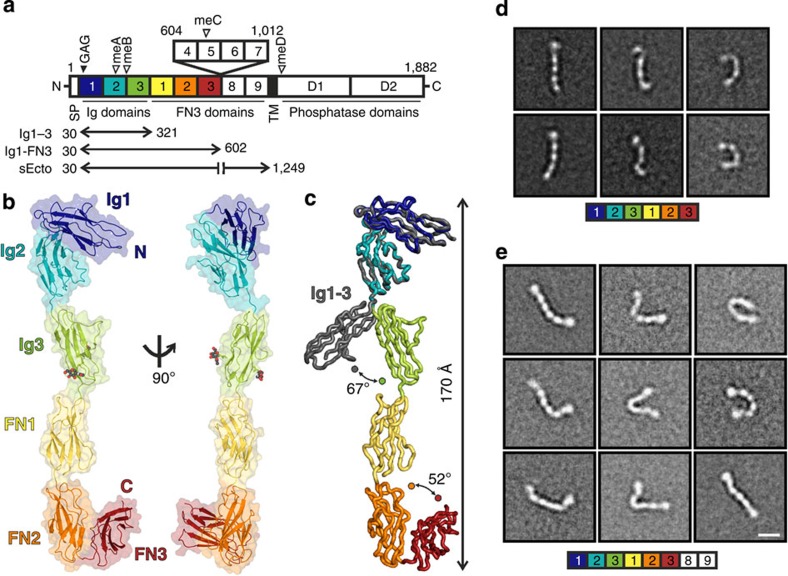
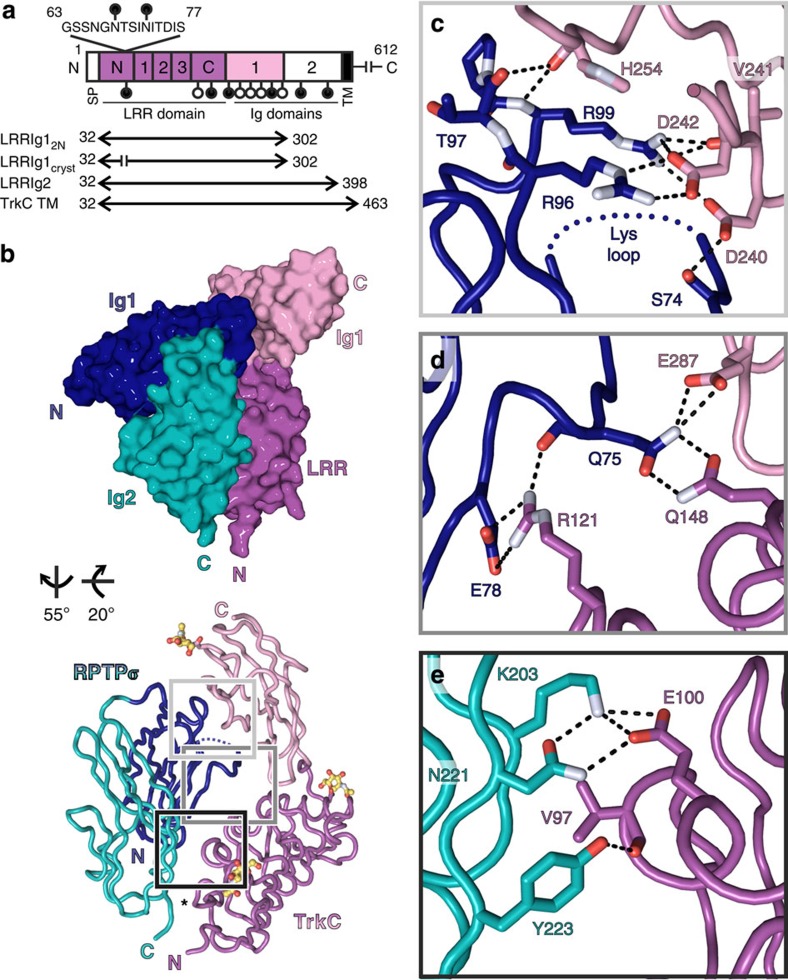
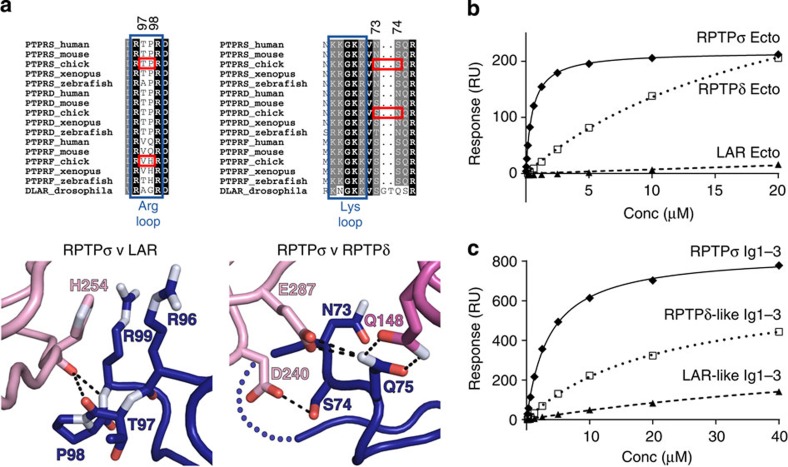
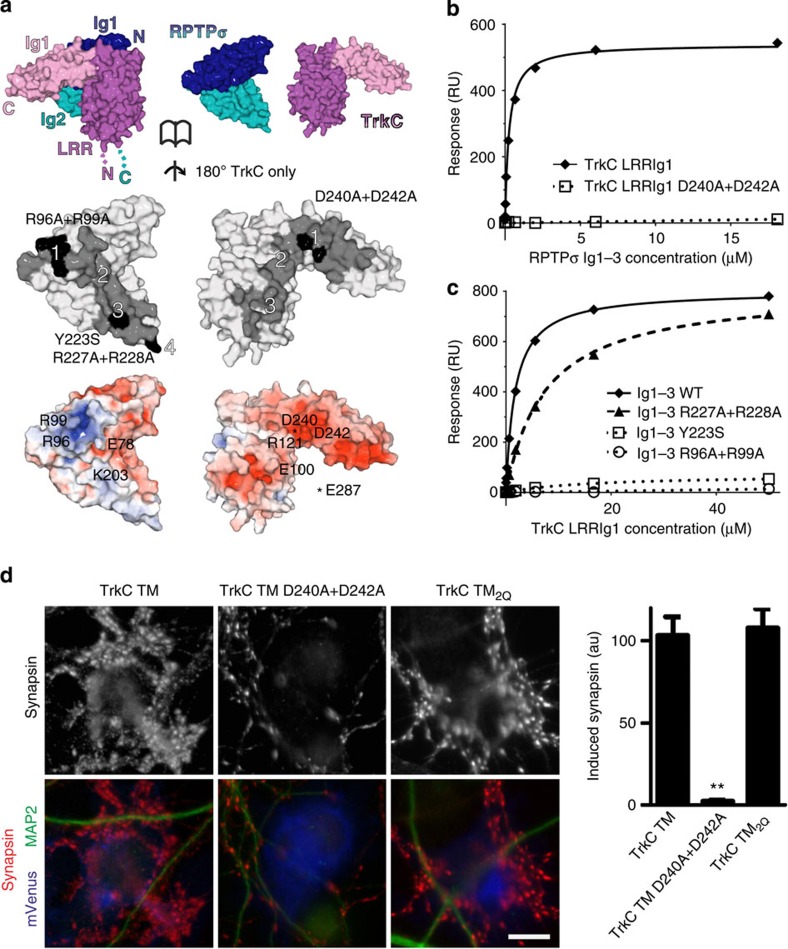
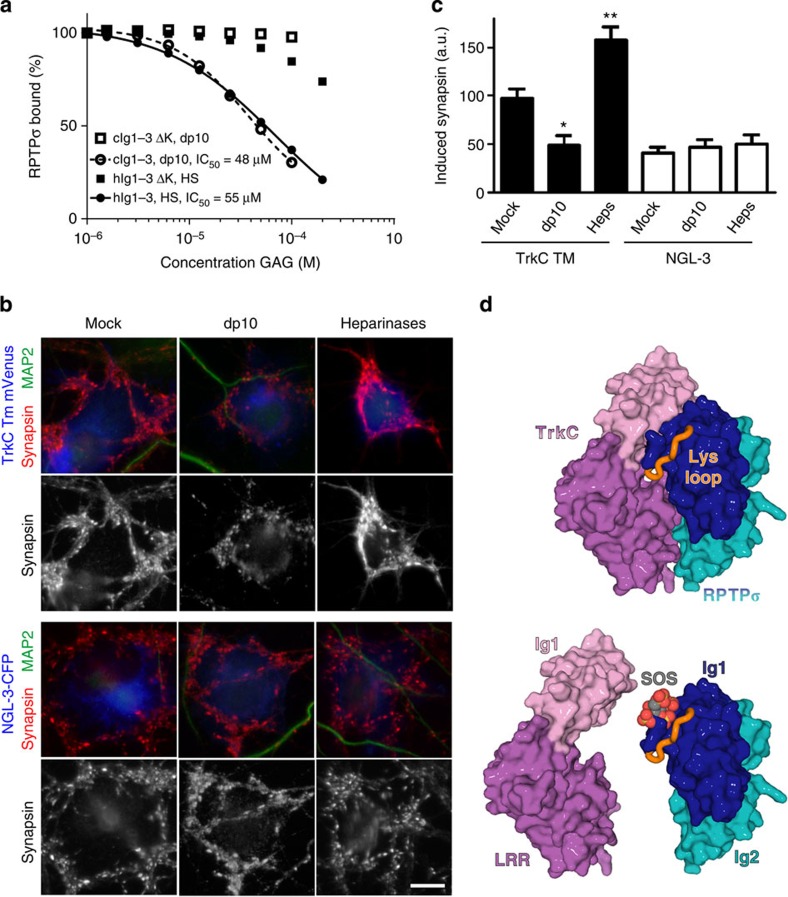
Receptor protein tyrosine phosphatase sigma (RPTPσ) regulates neuronal extension and acts as a presynaptic nexus for multiple protein and proteoglycan interactions during synaptogenesis. Unknown mechanisms govern the shift in RPTPσ function, from outgrowth promotion to synaptic organization. Here, we report crystallographic, electron microscopic and small-angle X-ray scattering analyses, which reveal sufficient inter-domain flexibility in the RPTPσ extracellular region for interaction with both cis (same cell) and trans (opposite cell) ligands. Crystal structures of RPTPσ bound to its postsynaptic ligand TrkC detail an interaction surface partially overlapping the glycosaminoglycan-binding site. Accordingly, heparan sulphate and heparin oligomers compete with TrkC for RPTPσ binding in vitro and disrupt TrkC-dependent synaptic differentiation in neuronal co-culture assays. We propose that transient RPTPσ ectodomain emergence from the presynaptic proteoglycan layer allows capture by TrkC to form a trans-synaptic complex, the consequent reduction in RPTPσ flexibility potentiating interactions with additional ligands to orchestrate excitatory synapse formation.


Figures

Figure 1
Figure 1. RPTPσ ectodomain flexibility.
(a) RPTPσ domain organization. N, amino-terminus (extracellular); SP, secretion signal peptide; TM, transmembrane; C, C terminus (intracellular); Ig, immunoglobulin-like; FN, fibronectin type-III; GAG, glycosaminoglycan-binding site (filled arrowhead). Alternative splicing inserts: FN domains 4–7 and mini-exons A–D (open arrowhead). (b) Ribbon and surface representations of the human RPTPσ Ig1-FN3 crystal structure. N-linked glycans in atom representation. (c) Ig3 movement in Ig1-FN3 relative to Ig1–3 (grey, PDB ID: 2YD9) structure. Representative RPTPσ Ig1-FN3 (d) and RPTPσ sEcto (e) negative-stain electron microscopy class averages. Scale bar, 10 nm. Full sets of RPTPσ Ig1-FN3 and sEcto class averages are provided in Supplementary Figs 2 and 3.
Figure 2
Figure 2. Trans-synaptic RPTPσ:TrkC complex crystal structure.
(a) TrkCTK- (non-catalytic isoform) domain organization. LRR, leucine-rich repeat region (N, N-terminal cysteine-rich region; 1–3, leucine-rich repeats; C, C-terminal cysteine-rich region). Putative N-linked glycosylation sites, lollipops; filled lollipops remain in LRRIg1cryst construct. (b) Space-filled and tube representations of chicken RPTPσ Ig1–2:TrkC LRRIg1cryst crystal structure. N-linked glycans in atom representation. Disordered RPTPσ Lys-loop, blue dotted line; TrkC LRRIg1cryst amino-acid residue 62–78 junction, asterisk. (ce) Detailed view of bonding interactions at RPTPσ:TrkC interface for binding sites 1–3. Corresponding electron density is illustrated in Supplementary Fig. 7. Potential electrostatic and hydrogen bonds, black dashed lines; oxygen atoms, red; nitrogen atoms, bluewhite.
Figure 3
Figure 3. TrkC binding preferences for type IIa RPTP family members.
(a) Type IIa RPTP sequence alignments and detailed views of the RPTPσ:TrkC crystal structure at binding site 1 (left) and binding site 2 (right). Blue boxes indicate RPTPσ residues required for proteoglycan binding, and red boxes highlight key sequence differences conferring TrkC-binding specificity. Colour scheme as in Fig. 2: dark blue, RPTPσ Ig1; pink, TrkC LRR; magenta, TrkC Ig1. (b) SPR analysis of human type IIa RPTP ectodomains binding to immobilized mouse TrkC LRRIg1. Measured binding values: RPTPσ Ecto, Kd=516 nM and Bmax=217 RU; RPTPδ Ecto, Kd>22 μM and Bmax>433 RU; RPTP LAR, Kd and Bmax not determined. (c) SPR analysis of chicken TrkC LRRIg1 binding to immobilized chicken RPTPσ Ig1–3, RPTPσ N73S+S74N (RPTPδ-like) Ig1–3 and RPTPσ P97V+T98H (LAR-like) Ig1–3. Measured binding values: RPTPσ Ig1–3, Kd=3.5 μM and Bmax=837 RU; RPTPδ-like Ig1–3, Kd>21 μM and Bmax>674 RU; RPTP LAR-like Ig1–3, Kd and Bmax not determined. For sensograms see Supplementary Fig. 8a,b.
Figure 4
Figure 4. Validation of RPTPσ:TrkC binding interfaces.
(a) Opened-view surface representation of the chicken RPTPσ Ig1–2:TrkC LRRIg1cryst crystal structure. RPTPσ and TrkC interface residues are coloured grey and interface mutants used in biophysical and cellular assays are highlighted in black (middle panel). Binding sites 1–4 are labelled. RPTPσ and TrkC are coloured by electrostatic potential (bottom panel) from red (−8 kT/e) to blue (+8 kT/e), illustrating complementary charged patches at binding sites 1–3 (note that the basic RPTPσ ‘Lys-loop’ residues 68–71 are absent in the RPTPσ:TrkC complex crystallographic model). (b) SPR analysis of human RPTPσ Ig1–3 binding to immobilized mouse TrkC LRRIg1 and TrkC LRRIg1 D240A+D242A. Measured binding values: TrkC LRRIg1, Kd=258 nM and Bmax=540 RU; TrkC LRRIg1 D240A+D242A, Kd and Bmax not determined. (c) Mouse TrkC LRRIg1 binding to immobilized human RPTPσ Ig1–3 WT, R96A+R99A, Y223S and R227A+R228A. Measured binding values: RPTPσ Ig1–3 WT, Kd=1.8 μM and Bmax=802 RU; Ig1–3 R227A+R228A, Kd=7 μM and Bmax=806 RU; Ig1–3 R96A+R99A and Y223S, Kd and Bmax not determined. For sensograms see Supplementary Fig. 8c–f. (d) Induced synapsin clustering in rat hippocampal neurons by TrkC TM (WT), TrkC TM_D240A+D242A and TrkC TM2Q expressing COS-7 cells. Analysis of variance, P<0.0001; **P<0.001 compared with TrkC TM by post hoc Bonferroni’s multiple comparison test, n=26 cells from two experiments. Scale bar, 10 μM. Relative cell surface expression levels are shown in Supplementary Fig. 9.
Figure 5
Figure 5. Characterization of the potential accessory RPTPσ:TrkC-binding site 4.
(a) SPR analysis of chicken RPTPσ Ig1–3 binding to immobilized chicken TrkC LRRIg1cryst, LRRIg12N and LRRIg12Q. Measured binding values: TrkC LRRIg1cryst, Kd=4.8 μM and Bmax=761 RU; LRRIg12N, Kd=216 nM and Bmax=416 RU; LRRIg12Q, Kd=38 nM and Bmax=590 RU. For sensograms see Supplementary Fig. 8g–h. (b) Alignment of the two RPTPσ:TrkC complexes observed in the chicken RPTPσ Ig1–2:TrkC LRRIg1cryst (P2 space group) and three in the chicken RPTPσ Ig1–3:TrkC LRRIg12Q (P1 space group) crystal structures. The orientation of the structures is identical to Fig. 2b (lower panel). (c) Additional features observed in complex 1 from the RPTPσ Ig1–3:TrkC LRRIg12Q crystal structure. Residues within the 63–77 loop that were not present in the P2 crystal structure are coloured blue and the remaining missing residues are indicated by dotted lines. View rotated relative to b as indicated. TrkC LRR, magenta; RPTPσ, cyan. (d) SigmaA weighted 2Fo−Fc electron density map (grey) contoured at 1σ and carved at 2.2 Å around loop residues 69–76.
Figure 6
Figure 6. GAG-mediated inhibition of synaptic RPTPσ:TrkC interaction and function.
(a) SPR analysis of human RPTPσ Ig1–3 and RPTPσ Ig1–3 ΔK binding to immobilized mouse TrkC LRRIg1 in the presence of increasing concentrations of HS or heparin-dp10. For sensograms see Supplementary Fig. 10a,b. (b,c) Induced synapsin clustering in rat hippocampal neurons by COS-7 cells expressing TrkC TM or NGL-3 in the presence of heparin-dp10, heparinases (Heps) or mock control. Analysis of variance P<0.0001, *P<0.01 and **P<0.001 compared with TrkC TM mock, whereas NGL-3 heparin-dp10 or heparainase groups were not significantly different from NGL-3 mock by post hoc Bonferroni’s multiple comparison test, n=16–26 cells from two experiments. Scale bar, 10 μM. (d) Illustration of the partial overlap between GAG- and TrkC-binding sites on RPTPσ. Top panel: the RPTPσ:TrkC complex, rotated 180° around the y axis relative to Fig. 2b. Lower panel: sucrose octasulphate (SOS, grey/red) is modelled in the RPTPσ GAG-binding site, an equivalent location to that observed in the LAR:SOS co-crystal structure (which is homologous with RPTPσ, PDB ID: 2YD8). SOS (or GAG) binding can out-compete the TrkC interaction with RPTPσ.
Figure 7
Figure 7. Model illustrating flexible RPTPσ ectodomain sampling of extracellular ligands.
(a) At the growth cone, RPTPσ interacts with cell surface and basal membrane proteoglycans to mediate axonal extension. (b) Upon contact with target cells, to shift to the role of synaptic organizer, RPTPσ adopts elongated conformations to protrude from the presynaptic proteoglycan haze and bind postsynaptic ligands such as TrkC and NGL-3. Subsequent independent or coordinated interactions with additional synaptic ligands are shown. Red boxes (left hand panels) indicate growth cone (a) or synapse (b) regions that are illustrated in the right-hand cartoons.

References

    1. Siddiqui T. J. & Craig A. M. Synaptic organizing complexes. Curr. Opin. Neurobiol. 21, 132–143 (2011). - PMC - PubMed
    1. Shen K. & Scheiffele P. Genetics and cell biology of building specific synaptic connectivity. Annu. Rev. Neurosci. 33, 473–507 (2010). - PMC - PubMed
    1. Good M. C., Zalatan J. G. & Lim W. A. Scaffold proteins: hubs for controlling the flow of cellular information. Science 332, 680–686 (2011). - PMC - PubMed
    1. Craig A. M. & Kang Y. Neurexin-neuroligin signaling in synapse development. Curr. Opin. Neurobiol. 17, 43–52 (2007). - PMC - PubMed
    1. Bell C. H. et al. Structure of the repulsive guidance molecule (RGM)-neogenin signaling hub. Science 341, 77–80 (2013). - PMC - PubMed

Publication types

MeSH terms

LinkOut - more resources