. 2014 Nov 25;111(47):16925-30.
doi: 10.1073/pnas.1412051111. Epub 2014 Nov 10.

High-speed odor transduction and pulse tracking by insect olfactory receptor neurons

Affiliations

High-speed odor transduction and pulse tracking by insect olfactory receptor neurons

Paul Szyszka et al. Proc Natl Acad Sci U S A. .

Abstract

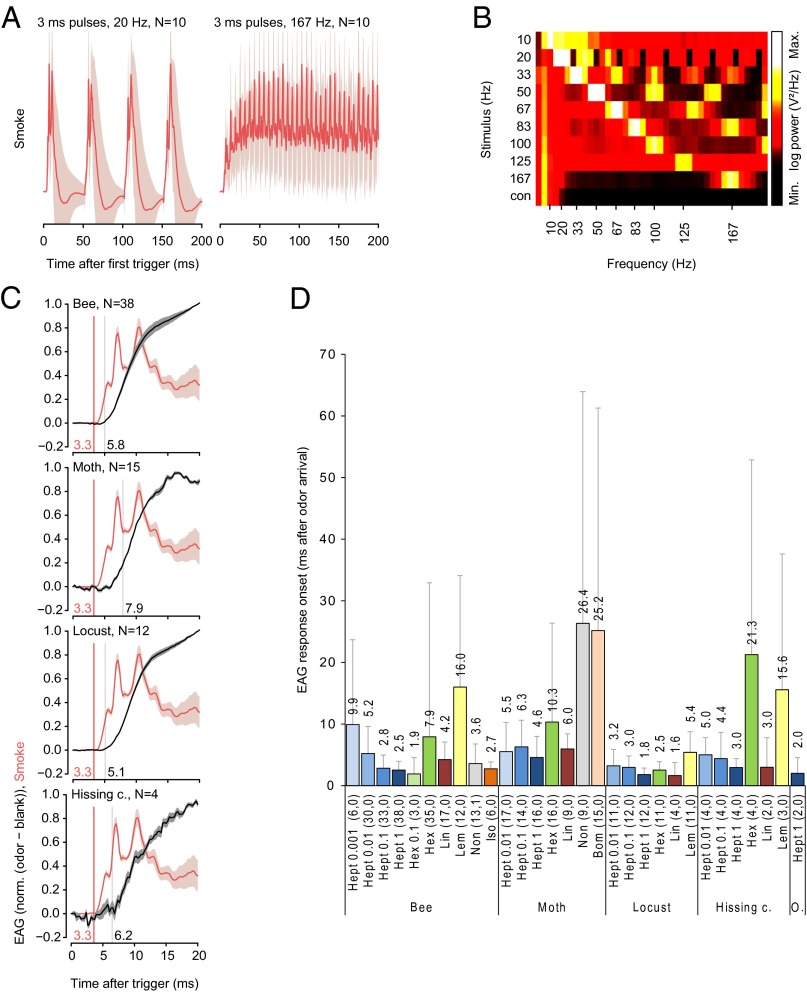
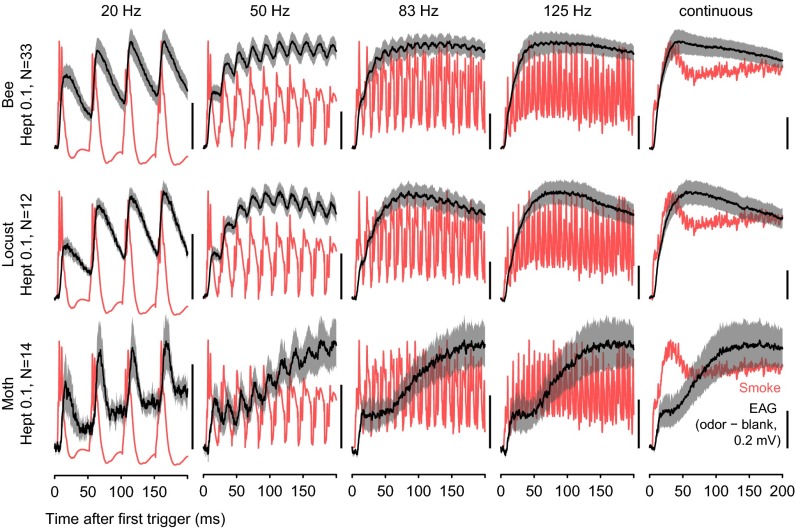
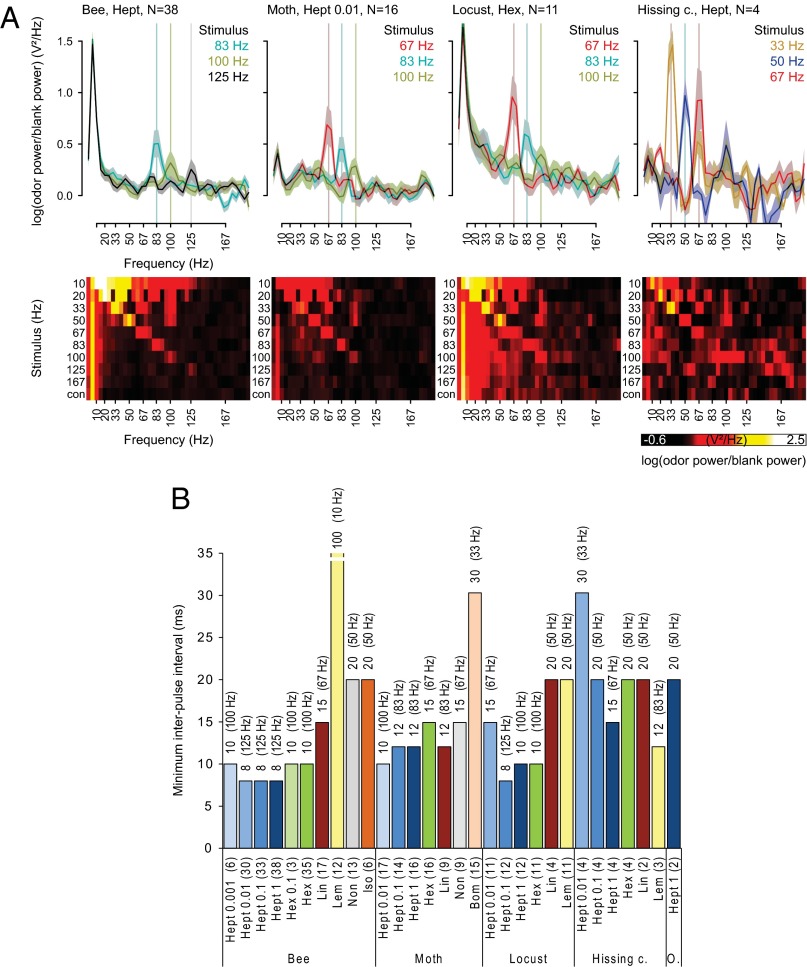
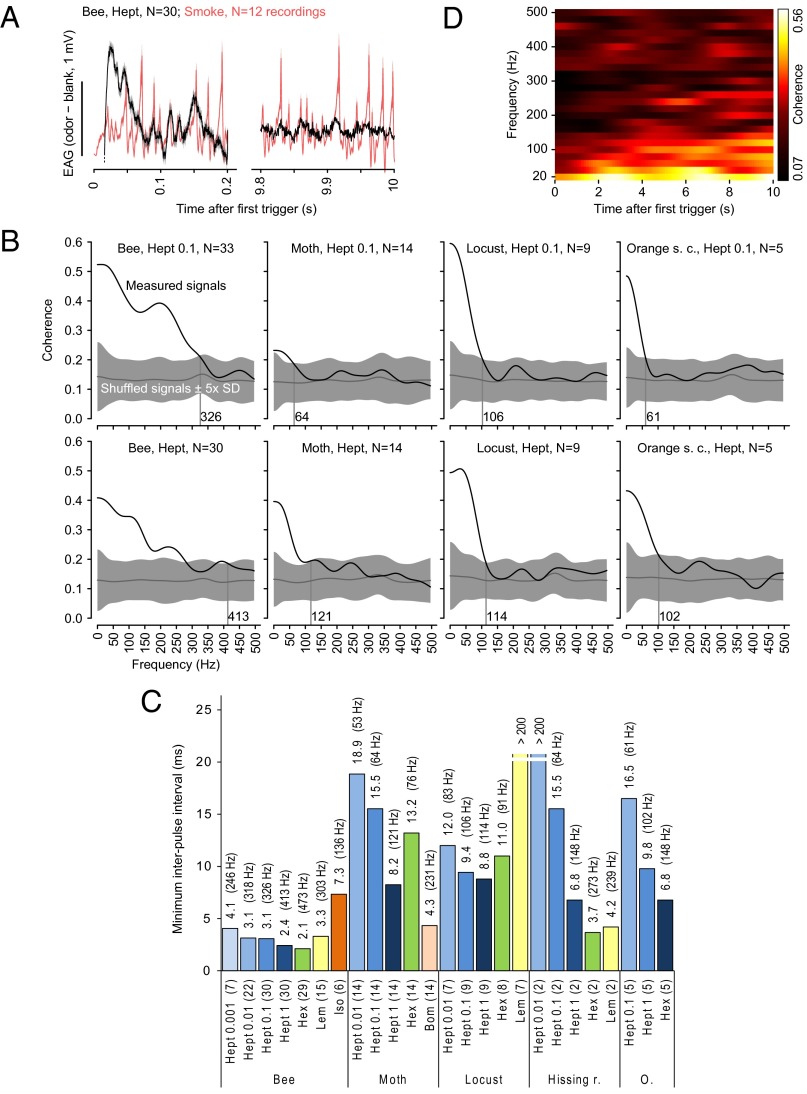
Sensory systems encode both the static quality of a stimulus (e.g., color or shape) and its kinetics (e.g., speed and direction). The limits with which stimulus kinetics can be resolved are well understood in vision, audition, and somatosensation. However, the maximum temporal resolution of olfactory systems has not been accurately determined. Here, we probe the limits of temporal resolution in insect olfaction by delivering high frequency odor pulses and measuring sensory responses in the antennae. We show that transduction times and pulse tracking capabilities of olfactory receptor neurons are faster than previously reported. Once an odorant arrives at the boundary layer of the antenna, odor transduction can occur within less than 2 ms and fluctuating odor stimuli can be resolved at frequencies more than 100 Hz. Thus, insect olfactory receptor neurons can track stimuli of very short duration, as occur when their antennae encounter narrow filaments in an odor plume. These results provide a new upper bound to the kinetics of odor tracking in insect olfactory receptor neurons and to the latency of initial transduction events in olfaction.

Keywords: insect; odor transduction; olfaction; olfactory receptor neurons; temporal resolution.


Conflict of interest statement

The authors declare no conflict of interest.

Figures

Fig. 1.
Fig. 1.
Olfactory transduction onset can occur in less than 2 ms. (A) Stimulus dynamics visualized with TiCl4 smoke during 20 Hz and 167 Hz pulse series. A laser was positioned at the location of the antenna, and the resulting light reflectance of the smoke was recorded with a photodiode (mean ± SEM). SE (SEM) is visualized as a shaded area. (B) Color-coded periodograms of visualized TiCl4 smoke signals show that the odor delivery device is capable of producing pulse frequencies between 10 and 167 Hz. (C) TiCl4 smoke signals (red, n = 16) and EAG responses to 2-heptanone (black) (mean ± SEM). For EAG recordings, odor and blank stimuli were alternated, and the blank control was subtracted from every preceding odor-evoked EAG signal. Signals were averaged across 10 recordings for each antenna. n, number of averaged antennae. The values at the vertical lines are the computed onset times in milliseconds. (D) Summary of mean EAG response onsets for different insect species and odors. The TiCl4 smoke signal onset time (3.3 ms) was subtracted from the EAG onset times to get the real EAG onset. Numbers in the graph show the mean EAG onset. Experiments are grouped at the bottom by species and then odorant and dilution, with the number of antennae in parentheses. O, orange spotted cockroach.
Fig. 2.
Fig. 2.
EAG responses in different insect species. EAG responses (black, mean ± SEM) to 20, 50, 83, and 125 Hz pulse series and a continuous stimulus in three insect species are shown. TiCl4 smoke signals (red) show the stimulus dynamic.
Fig. 3.
Fig. 3.
Antennal responses track pulses at 125 Hz in a 1-s-long odor stimulus. (A) Periodograms (mean ± SEM) of the EAG responses for the three highest resolved pulse frequencies for different odors in different insect species, and color-coded periodograms for all pulse series for the same species-odor combination. A peak in the periodogram indicates that the EAG response followed that stimulus frequency. (B) Temporal resolution of EAG responses quantified as the minimum interpulse interval in milliseconds (1/maximum pulse frequency) that an EAG response could follow. Minimum interpulse intervals were determined by locating the peak of the average periodogram in a ± 20-Hz window around the stimulus frequency. Pulse following was ascertained if the negative SE of the peak location rose above the positive SE of the trough location within that window. The corresponding pulse tracking frequencies are given in parentheses. The number of antennae is given in parentheses above the odorant.
Fig. 4.
Fig. 4.
Antennal responses track odor fluctuations in the hundreds of Hertz range during a persistent broadband stimulus. (A) TiCl4 smoke signals (red, n = 12) and odor-evoked EAG responses (black, 20 Hz high-pass filtered, onset truncated, n = 30) (mean ± SEM) during 0–0.2 and 9.8–10 s of a 10-s-long broadband frequency stimulus train with random pulse durations and intervals. (B) Coherence between mean EAG responses and TiCl4 smoke signals (black) and coherence between mean EAG response and a shuffled TiCl4 smoke signal (gray, mean ± 5 SD). The first 1,000 and the last 100 ms of the 10-s-long broadband stimulus were skipped to avoid onset/offset effects. Coherence was defined significant when it was larger than the coherence for the shuffled data plus 5 SD. Values at the vertical lines are the maximum frequencies at which the EAG response shows significant coherence. (C) Temporal resolution of EAG responses quantified as the minimum interpulse interval in milliseconds (1/maximum pulse frequency) at which the coherence was significant, i.e., larger than the coherence for the shuffled data plus 5 SD. The corresponding pulse tracking frequencies are given in parentheses. Experiments are grouped at the bottom by species and then odorant and dilution, with the number of antennae in parentheses. (D) Time-resolved, color-coded coherence between the mean honey bee EAG response to undiluted 2-heptanone and the mean TiCl4 smoke signal (same data as in Fig. 4A). The time-resolved coherence indicates the degree to which the EAG response is phase-locked to the fluctuations of the odor concentration, as opposed to merely matching the frequency. Substantial coherence at high frequencies is visible throughout the odor presentation, indicating that tracking can persist for several seconds.

References

    1. Murlis J, Elkinton JS, Carde RT. Odor plumes and how insects use them. Annu Rev Entomol. 1992;37:505–532.
    1. Baker TC, Fadamiro HY, Cosse AA. Moth uses fine tuning for odour resolution. Nature. 1998;393(6685):530.
    1. Fadamiro HY, Cosse AA, Baker TC. Fine-scale resolution of closely spaced pheromone and antagonist filaments by flying male Helicoverpa zea. J Comp Physiol A Neuroethol Sens Neural Behav Physiol. 1999;185(2):131–141.
    1. Nikonov AA, Leal WS. Peripheral coding of sex pheromone and a behavioral antagonist in the Japanese beetle, Popillia japonica. J Chem Ecol. 2002;28(5):1075–1089. - PubMed
    1. Andersson MN, Binyameen M, Sadek MM, Schlyter F. Attraction modulated by spacing of pheromone components and anti-attractants in a bark beetle and a moth. J Chem Ecol. 2011;37(8):899–911. - PubMed

Publication types