. 2014 Nov 25;111(47):16772-7.
doi: 10.1073/pnas.1413481111. Epub 2014 Nov 10.

Prediction of interindividual differences in hepatic functions and drug sensitivity by using human iPS-derived hepatocytes

Affiliations

Prediction of interindividual differences in hepatic functions and drug sensitivity by using human iPS-derived hepatocytes

Kazuo Takayama et al. Proc Natl Acad Sci U S A. .

Abstract

Interindividual differences in hepatic metabolism, which are mainly due to genetic polymorphism in its gene, have a large influence on individual drug efficacy and adverse reaction. Hepatocyte-like cells (HLCs) differentiated from human induced pluripotent stem (iPS) cells have the potential to predict interindividual differences in drug metabolism capacity and drug response. However, it remains uncertain whether human iPSC-derived HLCs can reproduce the interindividual difference in hepatic metabolism and drug response. We found that cytochrome P450 (CYP) metabolism capacity and drug responsiveness of the primary human hepatocytes (PHH)-iPS-HLCs were highly correlated with those of PHHs, suggesting that the PHH-iPS-HLCs retained donor-specific CYP metabolism capacity and drug responsiveness. We also demonstrated that the interindividual differences, which are due to the diversity of individual SNPs in the CYP gene, could also be reproduced in PHH-iPS-HLCs. We succeeded in establishing, to our knowledge, the first PHH-iPS-HLC panel that reflects the interindividual differences of hepatic drug-metabolizing capacity and drug responsiveness.

Keywords: CYP2D6; SNP; hepatocyte; human iPS cells; personalized drug therapy.


Conflict of interest statement

The authors declare no conflict of interest.

Figures
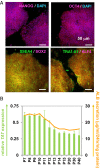
Fig. 1.
Fig. 1.
Establishment and characterization of human iPSCs generated from PHHs. (A) The PHH-iPSCs were subjected to immunostaining with anti-NANOG (red), OCT4 (red), SSEA4 (green), SOX2 (red), TRA1-81 (green), and KLF4 (red) antibodies. Nuclei were counterstained with DAPI (blue) (Upper). (B) The TAT expression and ALB secretion levels in the PHH-iPS-HLCs (P7–P40) were examined. On the y axis, the gene expression level of TAT in PHHs was taken as 1.0.
Fig. 2.
Fig. 2.
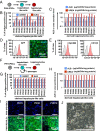
Highly efficient hepatocyte differentiation from PHH-iPSCs independent of their differentiation tendency. (A) PHH-iPSCs were differentiated into the HLCs via the HBCs. (B) On day 25 of differentiation, the efficiency of hepatocyte differentiation was measured by estimating the percentage of ASGR1- or ALB-positive cells using FACS analysis. (C) The amount of ALB or urea secretion was examined in PHH-iPS-HLCs. (D) The percentage of AFP-positive cells in PHH-iPS-HBCs was examined by using FACS analysis (Left). The PHH-iPS-HBCs were subjected to immunostaining with anti-AFP (green) antibodies. Nuclei were counterstained with DAPI (blue) (Right). (E) The percentage of EpCAM- and CD133-positive cells in PHH-iPS-HBCs was examined by using FACS analysis (Left). (F) PHH-iPSCs were differentiated into the hepatic lineage, and then PHH-iPS-HBCs were purified and maintained for three passages on human LN111. Thereafter, expanded PHH-iPS-HBCs were differentiated into the HLCs. (G) The efficiency of hepatic differentiation from PHH-iPS-HBCs was measured by estimating the percentage of ASGR1- or ALB-positive cells using FACS analysis. (H) The amount of ALB or urea secretion in PHH-iPS-HLCs was examined. Data represent the mean ± SD from three independent differentiations. (I) The PHH1-, 6-, or 10-iPS-HBCs and -HLCs were subjected to immunostaining with anti-αAT (green) antibodies. Nuclei were counterstained with DAPI (blue). (J) A phase-contrast micrograph of PHH-iPS-HLCs.
Fig. 3.
Fig. 3.
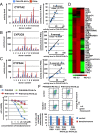
The drug metabolism capacity and drug responsiveness of PHH-iPS-HLCs were highly correlated with those of their parental PHHs. (AC) CYP1A2 (A), -2C9 (B), and -3A4 (C) activity levels in PHH-iPS-HLCs and PHHs were measured by LC-MS/MS analysis. The R-squared values are indicated in each figure. (D) The global gene expression analysis was performed in PHH9-iPSCs, PHH9-iPS-HLCs, PHH9s, and HepG2 (PHH-iPSCs, PHH-iPS-HLCs, and PHHs are genetically identical). Heat-map analyses of liver-specific genes are shown. (E) The cell viability of PHH5/6/9, PHH1/2/12, PHH5/6/9-iPS-HLCs, and PHH1/2/12-iPS-HLCs was examined after 24 h exposure to different concentrations of benzbromarone. The cell viability was expressed as a percentage of that in the cells treated only with solvent. (F) The percentage of cells with energized mitochondria in the DMSO-treated (control, Upper) or benzbromarone-treated (Lower) cells based on FACS analysis. Double-positive cells (green+/orange+) represent energized cells, whereas single-positive cells (green+/orange−) represent apoptotic and necrotic cells. Data represent the mean ± SD from three independent experiments (Lower Graph). Student t test indicated that the percentages in the “control” were significantly higher than those in the “benzbromarone” group (P < 0.01). The “PHH5/6/9” represents the average value of cell viability (E) or mitochondrial membrane potential (F) in PHH5, PHH6, and PHH9. The “PHH1/2/12” represents the average value of cell viability or mitochondrial membrane potential in PHH1, PHH2, and PHH12. PHH5, PHH6, and PHH9 were the top three with respect to CYP2C9 activity levels, whereas PHH1, PHH2, and PHH12 had the lowest CYP2C9 activity levels.
Fig. 4.
Fig. 4.
The interindividual differences in CYP2D6 metabolism capacity and drug responsiveness induced by SNPs in CYP2D6 are reproduced in the PHH-iPS-HLCs. (A) SNPs (CYP2D6*3, *4, *5, *6, *7, *8, *16, and *21) in the CYP2D6 gene were analyzed. (B) The CYP2D6 activity levels in PHH-iPS-HLCs and PHHs were measured by LC-MS/MS analysis. (C) The pharmacological activity of tamoxifen-dependent conversion to its metabolite, endoxifen, by the CYP2D6. The coculture system of breast cancer cells (MCF-7 cells) and the PHH-iPS-HLCs are illustrated. (D) The cell viability of MCF-7 cells was assessed after 72-h exposure to different concentrations of tamoxifen. (E) The cell viability of MCF-7 cells, which were cocultured with PHH-WT, PHH-NUL, HLC-WT, and HLC-NUL, was assessed after 72-h exposure to 500 nM of tamoxifen in the presence or absence of 3 nM quinidine (a CYP2D6 inhibitor). (F) The cell viability of MCF-7 cells cocultured with Ad-CYP2D6-transduced PHH-NUL and HLC-NUL was examined after 72-h exposure to 500 nM of tamoxifen. (G and H) The CYP2D6 expression (G) and activity (H) levels in Ad-CYP2D6-transduced PHH-NUL and HLC-NUL were examined by Western blotting and LC-MS/MS analysis. (I) The detoxification of desipramine-dependent conversion to its conjugated form by the CYP2D6. (J) The cell viability of PHH-WT, PHH-NUL, HLC-WT, and HLC-NUL was assessed after 24-h exposure to different concentrations of desipramine. (K) The cell viability of the PHH-WT and HLC-WT was assessed after 24-h exposure to 5 μM of desipramine in the presence or absence of 5 μM of quinidine (a CYP2D6 inhibitor). (L) The cell viability of the Ad-CYP2D6-transduced PHH-NUL and HLC-NUL was examined after 24-h exposure to 5 μM of desipramine. The cell viability was expressed as a percentage of that in the cells treated with only solvent. Data represent the mean ± SD from three independent experiments. In E and K, Student t test indicated that the cell viability in the “control” was significantly higher than that in the “quinidine” group (P < 0.01). In F, H, and L, statistical significance was evaluated by ANOVA followed by Bonferroni post hoc tests to compare all groups. Groups that do not share the same letter are significantly different from each other (P < 0.05).

References

    1. Takayama K, et al. Efficient generation of functional hepatocytes from human embryonic stem cells and induced pluripotent stem cells by HNF4α transduction. Mol Ther. 2012;20(1):127–137. - PMC - PubMed
    1. Medine CN, et al. Developing high-fidelity hepatotoxicity models from pluripotent stem cells. Stem Cells Transl Med. 2013;2(7):505–509. - PMC - PubMed
    1. Ingelman-Sundberg M. Pharmacogenetics of cytochrome P450 and its applications in drug therapy: The past, present and future. Trends Pharmacol Sci. 2004;25(4):193–200. - PubMed
    1. Ingelman-Sundberg M. Genetic susceptibility to adverse effects of drugs and environmental toxicants. The role of the CYP family of enzymes. Mutat Res. 2001;482(1-2):11–19. - PubMed
    1. Zhou SF. Polymorphism of human cytochrome P450 2D6 and its clinical significance: Part I. Clin Pharmacokinet. 2009;48(11):689–723. - PubMed

Publication types

Substances

Associated data