. 2014 Nov 25;111(47):16802-7.
doi: 10.1073/pnas.1413374111. Epub 2014 Nov 10.

Sample processing obscures cancer-specific alterations in leukemic transcriptomes

Affiliations

Sample processing obscures cancer-specific alterations in leukemic transcriptomes

Heidi Dvinge et al. Proc Natl Acad Sci U S A. .

Abstract

Substantial effort is currently devoted to identifying cancer-associated alterations using genomics. Here, we show that standard blood collection procedures rapidly change the transcriptional and posttranscriptional landscapes of hematopoietic cells, resulting in biased activation of specific biological pathways; up-regulation of pseudogenes, antisense RNAs, and unannotated coding isoforms; and RNA surveillance inhibition. Affected genes include common mutational targets and thousands of other genes participating in processes such as chromatin modification, RNA splicing, T- and B-cell activation, and NF-κB signaling. The majority of published leukemic transcriptomes exhibit signals of this incubation-induced dysregulation, explaining up to 40% of differences in gene expression and alternative splicing between leukemias and reference normal transcriptomes. The effects of sample processing are particularly evident in pan-cancer analyses. We provide biomarkers that detect prolonged incubation of individual samples and show that keeping blood on ice markedly reduces changes to the transcriptome. In addition to highlighting the potentially confounding effects of technical artifacts in cancer genomics data, our study emphasizes the need to survey the diversity of normal as well as neoplastic cells when characterizing tumors.

Keywords: RNA splicing; batch effects; leukemia; nonsense-mediated decay.


Conflict of interest statement

The authors declare no conflict of interest.

Figures

Fig. 1.
Fig. 1.
Ex vivo blood incubation causes rapid transcriptional and posttranscriptional changes. (A) Biospecimen collection for solid and liquid tumors. (B) Blood sample processing. Whole blood samples frequently incur an ex vivo incubation between collection and processing, which we mimicked in the indicated time series. (C) RNA integrity numbers (RINs) from four individual healthy PBMC donors. For the cryopreserved samples (donors 1 and 2), the first time point was at 1 h rather than 0 h. (D) Numbers of differentially expressed protein-coding and noncoding transcripts and differentially spliced cassette exons relative to the first (0 or 1 h) time point. Legend is as in C. (E) Log2 ratio of numbers of up- vs. down-regulated transcripts or cassette exons with increased vs. decreased inclusion at 48 h. Legend is as in C. (F) RNA-seq coverage along excerpts of NOTCH2, LEF1, and PHF20 (donor 4). Introns are truncated at the vertical dashed lines. The inclusion of specific exons or introns (orange boxes) is time-dependent. (G) Overlap between differential gene expression or splicing in PBMCs (0 vs. 48 h; intersection of donors 3 and 4) and tumors vs. normal controls. Solid lines, median overlap per dataset; shading, first and third quartiles of the overlap; dashed lines, median across all solid tumors. Differential gene expression or splicing was computed for each tumor sample individually; the illustrated quantiles were computed over all tumor samples for each dataset. The control samples are as follows: lymphoid leukemias, t = 0h PBMCs; myeloid leukemias, median of four normal bone marrow samples; lymphomas, 0h PBMCs; B-ALL, B-cell acute lymphocytic leukemia; B-CLL, B-cell chronic lymphocytic leukemia; T-ALL, T-cell acute lymphocytic leukemia; AML, acute myeloid leukemia; aCML, atypical chronic myeloid leukemia. From left to right, datasets are from: lymphoid leukemias (–23), myeloid leukemias [Database of Genotypes and Phenotypes (dbGaP) study no. 2447; refs. , –27], lymphomas (29, 30), and solid tumors (TCGA).
Fig. 2.
Fig. 2.
Sample incubation affects the interpretation of leukemic gene expression. (A) Average absolute log2 fold change of differentially expressed genes (intersection of donors 3 and 4) associated with select GO terms enriched during ex vivo sample incubation. (B) Enrichment of the GO terms from A in differentially expressed genes in tumors vs. normal controls across a panel of lymphoid (green) and myeloid (purple) leukemias. Dataset order and references are as in Fig. 1G. Only genes differentially expressed in >25% of samples within each dataset were included in the GO enrichment analysis. (C) Overlap between up- and down-regulated genes, calculated as in B. Orange, PBMCs (0 vs. 48 h); green, B-CLL (21); purple, AML (dbGaP study no. 2447). (D) Principal components analysis of PBMCs (orange hues), B-CLL (green) (21), AML (purple), and normal bone marrow samples (28) (orange triangles). Clustering was performed by using 6,756 protein-coding genes with normalized expression more than five transcripts per million in ≥90% of samples. B-CLL samples are marked according to the proposed molecular subgroups C1 and C2 (31). (E) Log2 fold change after 48 h of incubation (intersection of donors 3 and 4) of genes differentially expressed between subgroups C1 and C2 (31), divided according to group with the highest expression level. Numbers indicate genes within each subtype.
Fig. 3.
Fig. 3.
Sample incubation dysregulates RNA processing and surveillance. (A) Increases (upper line) and decreases (lower line) in alternative splicing and intron retention of annotated constitutive splice junctions. (B) Overlap between alternatively spliced constitutive junctions in PBMCs after 48 h of incubation and lymphoid leukemias, both with respect to 0h PBMCs (–23). Color hue indicates number of putative novel isoforms. For leukemia datasets, only events that are alternatively spliced in >25% of samples are included. (C) Scatter plot of NMD substrates resulting from alternative splicing of cassette exons. Each dot represents the isoform ratio of a predicted NMD substrate created by inclusion or exclusion of a cassette exon. Red/blue, differentially spliced isoforms exhibiting changes in isoform ratio ≥10% relative to 0 h. (D) Increases (upper line) and decreases (lower line) in isoform ratios of isoforms that are predicted NMD substrates, subdivided by the type of splicing event. Numbers are normalized to the detected number of alternatively spliced events of each type that introduce or remove premature termination codons. (E) Accumulation of NMD substrates resulting from alternative splicing of cassette exons in normal PBMCs or bone marrow (orange), lymphoid leukemias (green), lymphomas (green), myeloid leukemias (purple), and solid tumors (gray). Dataset order and references are as in Fig. 1G. Numbers indicate tumor samples within each dataset. NMD accumulation is log2 of the ratio of increased vs. decreased NMD substrates, multiplied by the total number of alternatively spliced NMD substrates and normalized to the number of detected events. Positive ratios correspond to a decrease in NMD efficiency. Shaded box, changes in normal bone marrow samples.
Fig. 4.
Fig. 4.
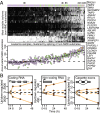
Sample incubation can be detected with biomarkers and ameliorated by ice. (A, Upper) Unsupervised clustering of normal PBMCs and bone marrow (orange), lymphoid leukemias (green), and myeloid leukemias (purple), based on a panel of 27 cassette exons with the largest splicing changes after 24 and 48 h (Dataset S3). Shading indicates exon inclusion (white, 0%; black, 100%). (Lower) Log2 accumulation of NMD substrates for the samples indicated in Upper. (B) Numbers of differentially expressed coding (Left) and noncoding (Center) genes and percent differentially spliced cassette exons (Right). Solid lines, whole blood incubated at room temperature; dashed lines, incubation on ice. Lines are averaged across donors 3 and 4.

References

    1. Leek JT, et al. Tackling the widespread and critical impact of batch effects in high-throughput data. Nat Rev Genet. 2010;11(10):733–739. - PMC - PubMed
    1. Chen C, et al. Removing batch effects in analysis of expression microarray data: An evaluation of six batch adjustment methods. PLoS ONE. 2011;6(2):e17238. - PMC - PubMed
    1. Johnson WE, Li C, Rabinovic A. Adjusting batch effects in microarray expression data using empirical Bayes methods. Biostatistics. 2007;8(1):118–127. - PubMed
    1. Scharpf RB, et al. A multilevel model to address batch effects in copy number estimation using SNP arrays. Biostatistics. 2011;12(1):33–50. - PMC - PubMed
    1. Li S, et al. Detecting and correcting systematic variation in large-scale RNA sequencing data. Nat Biotechnol. 2014;32(9):888–895. - PMC - PubMed

Publication types

Associated data