

Methane emissions from Alaska in 2012 from CARVE airborne observations
- PMID: 25385648
- PMCID: PMC4250099
- DOI: 10.1073/pnas.1412953111
Methane emissions from Alaska in 2012 from CARVE airborne observations
Abstract
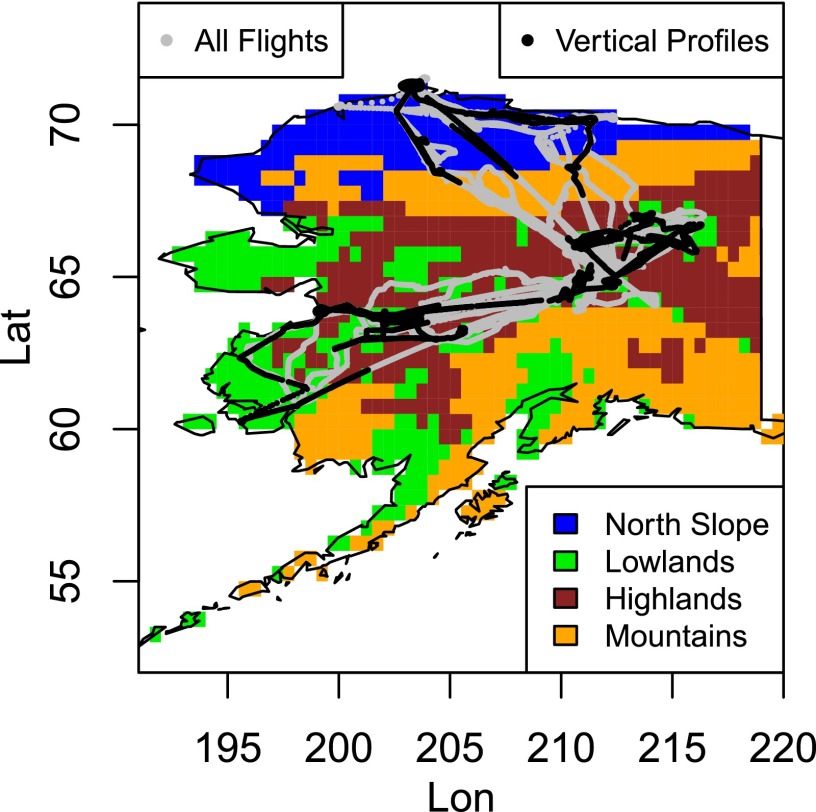
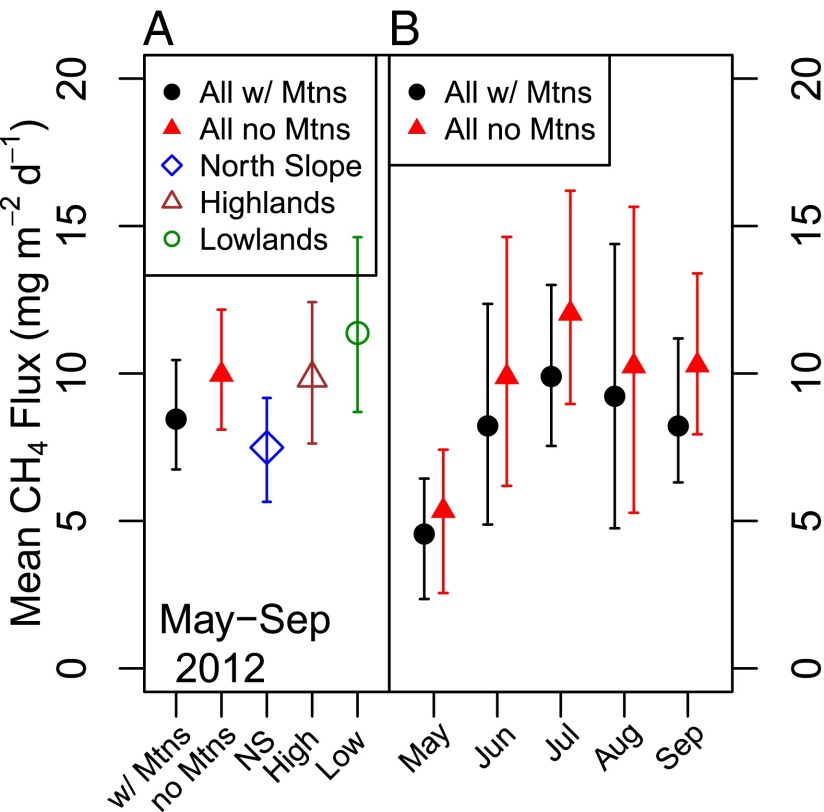
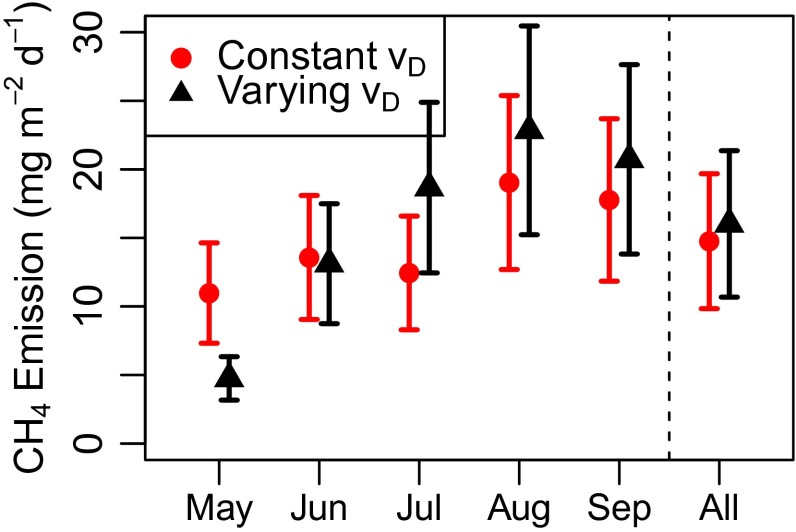
We determined methane (CH4) emissions from Alaska using airborne measurements from the Carbon Arctic Reservoirs Vulnerability Experiment (CARVE). Atmospheric sampling was conducted between May and September 2012 and analyzed using a customized version of the polar weather research and forecast model linked to a Lagrangian particle dispersion model (stochastic time-inverted Lagrangian transport model). We estimated growing season CH4 fluxes of 8 ± 2 mg CH4⋅m(-2)⋅d(-1) averaged over all of Alaska, corresponding to fluxes from wetlands of 56(-13)(+22) mg CH4⋅m(-2)⋅d(-1) if we assumed that wetlands are the only source from the land surface (all uncertainties are 95% confidence intervals from a bootstrapping analysis). Fluxes roughly doubled from May to July, then decreased gradually in August and September. Integrated emissions totaled 2.1 ± 0.5 Tg CH4 for Alaska from May to September 2012, close to the average (2.3; a range of 0.7 to 6 Tg CH4) predicted by various land surface models and inversion analyses for the growing season. Methane emissions from boreal Alaska were larger than from the North Slope; the monthly regional flux estimates showed no evidence of enhanced emissions during early spring or late fall, although these bursts may be more localized in time and space than can be detected by our analysis. These results provide an important baseline to which future studies can be compared.
Keywords: Alaska; Arctic; boreal; methane; tundra.
Conflict of interest statement
The authors declare no conflict of interest.
Figures


References
-
- Schuur EAG, et al. Vulnerability of carbon to climate change: Implications for the global carbon cycle. Bioscience. 2008;58(8):701–714.
-
- Shakhova N, et al. Extensive methane venting to the atmosphere from sediments of the East Siberian Arctic Shelf. Science. 2010;327(5970):1246–1250. - PubMed
-
- Walter Anthony KM, Anthony P, Grosse G, Chanton J. Geologic methane seeps along boundaries of Arctic permafrost thaw and melting glaciers. Nat Geosci. 2012;5(6):419–426.
-
- Tarnocai C, et al. Soil organic carbon pools in the northern circumpolar permafrost region. Global Biogeochem Cycles. 2009;23(2):GB2023.
-
- Hansen J, Ruedy R, Sato M, Lo K. Global surface temperature change. Rev Geophys. 2010;48(4):RG4004.
Publication types
LinkOut - more resources
Full Text Sources
Other Literature Sources
Miscellaneous
