Review
. 2014 Oct 24:5:206.
doi: 10.3389/fneur.2014.00206. eCollection 2014.

Central gain control in tinnitus and hyperacusis

Affiliations
Review

Central gain control in tinnitus and hyperacusis

Benjamin D Auerbach et al. Front Neurol. .

Abstract

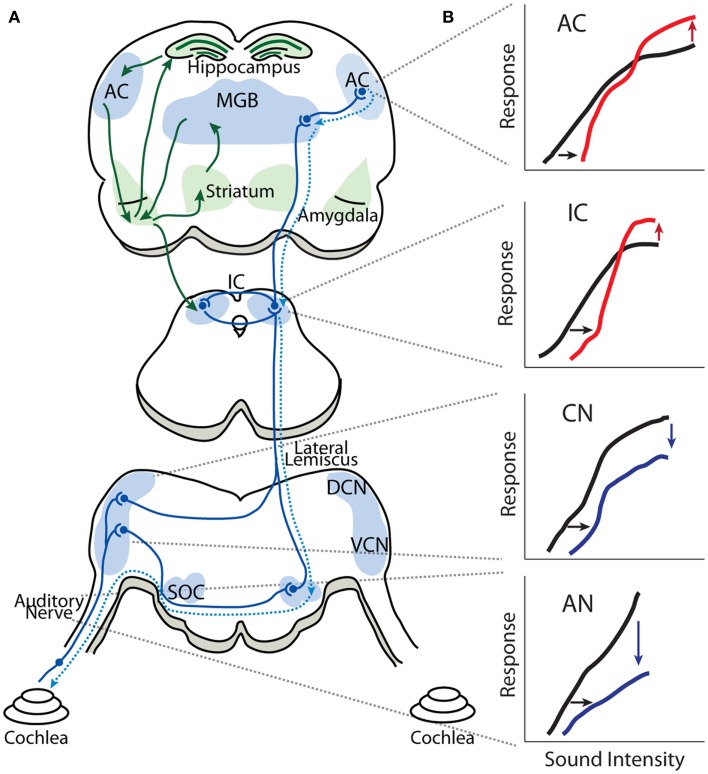
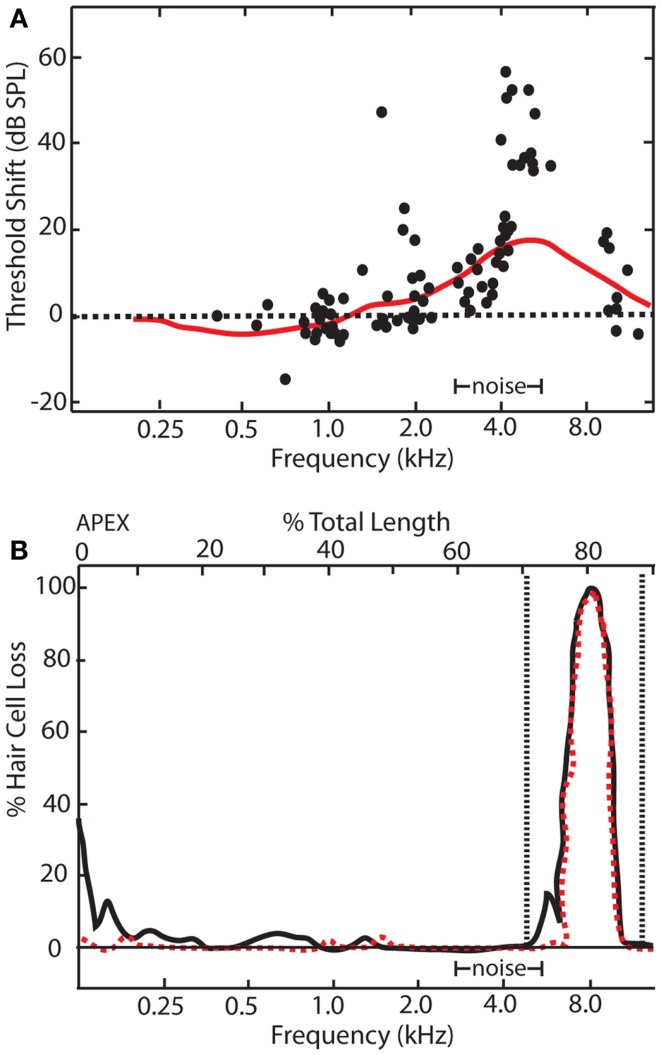
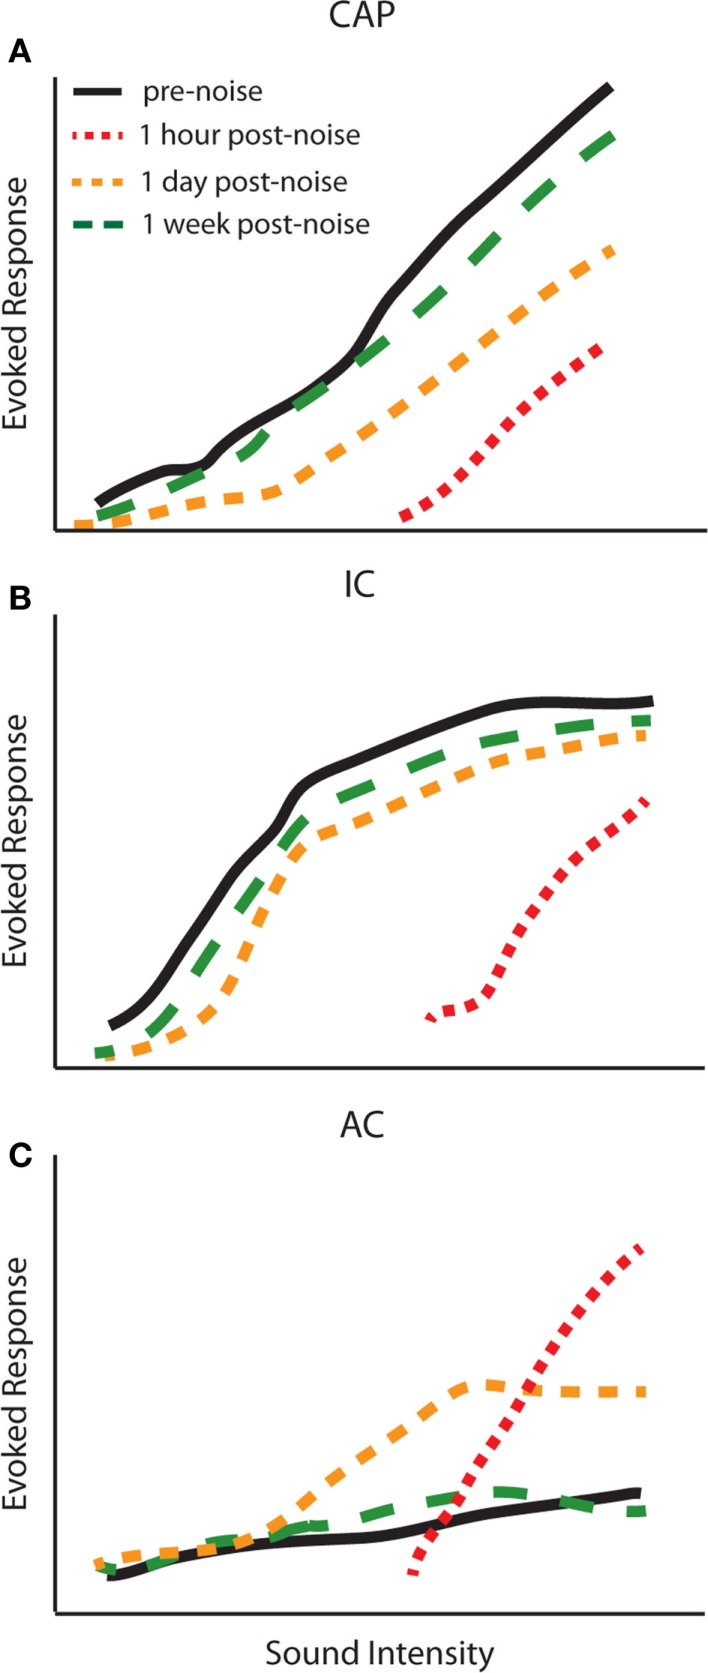
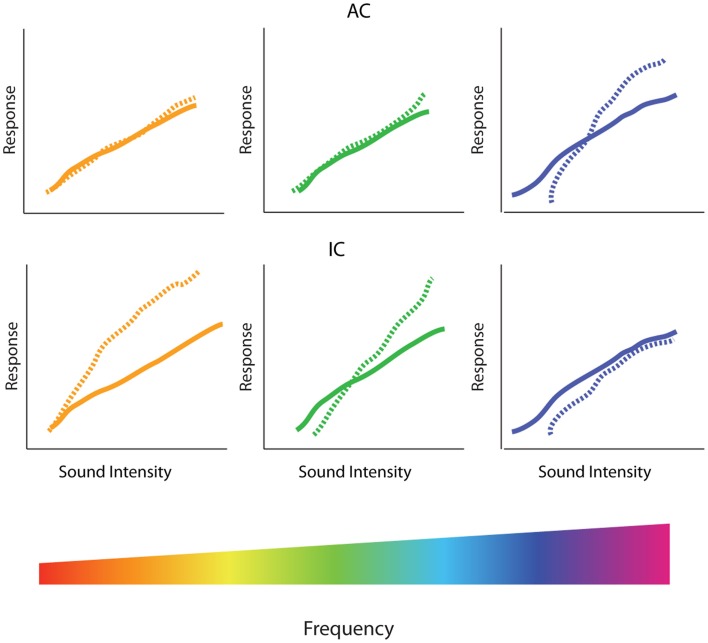
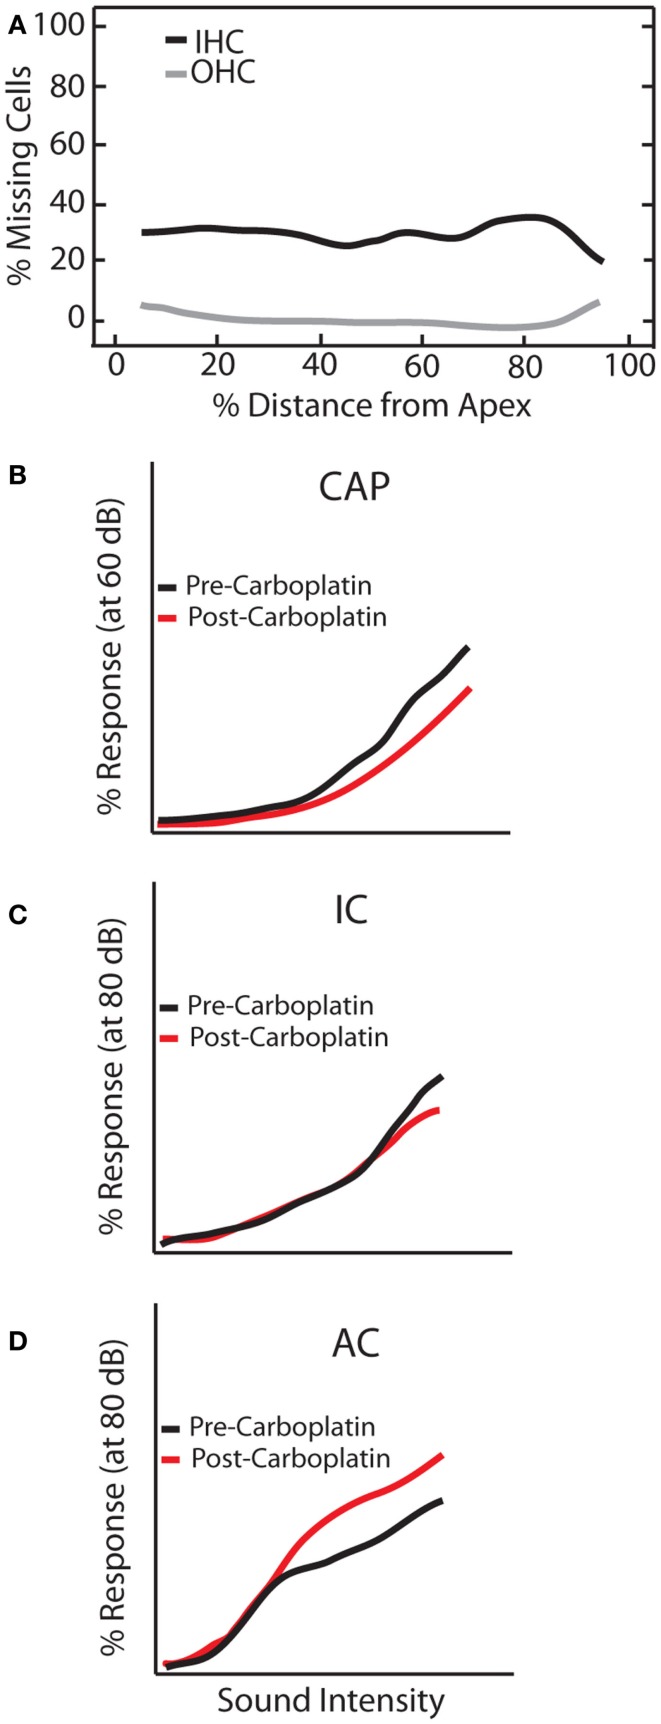
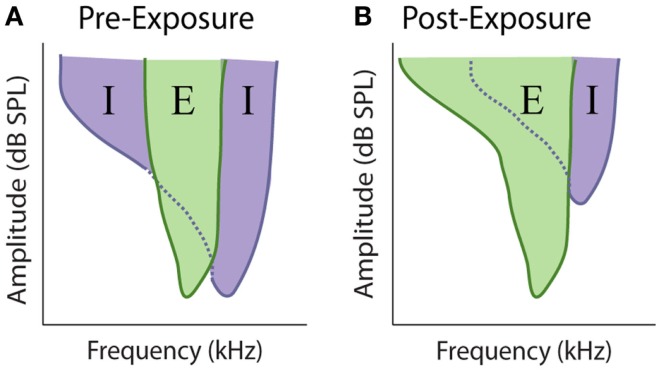
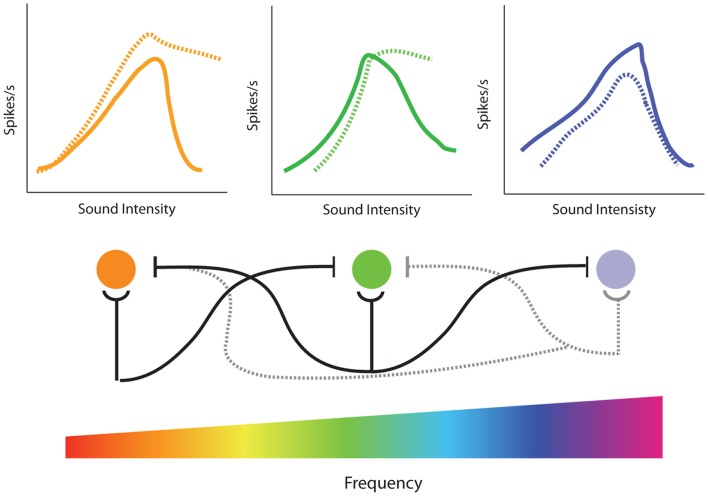
Sensorineural hearing loss induced by noise or ototoxic drug exposure reduces the neural activity transmitted from the cochlea to the central auditory system. Despite a reduced cochlear output, neural activity from more central auditory structures is paradoxically enhanced at suprathreshold intensities. This compensatory increase in the central auditory activity in response to the loss of sensory input is referred to as central gain enhancement. Enhanced central gain is hypothesized to be a potential mechanism that gives rise to hyperacusis and tinnitus, two debilitating auditory perceptual disorders that afflict millions of individuals. This review will examine the evidence for gain enhancement in the central auditory system in response to cochlear damage. Further, it will address the potential cellular and molecular mechanisms underlying this enhancement and discuss the contribution of central gain enhancement to tinnitus and hyperacusis. Current evidence suggests that multiple mechanisms with distinct temporal and spectral profiles are likely to contribute to central gain enhancement. Dissecting the contributions of these different mechanisms at different levels of the central auditory system is essential for elucidating the role of central gain enhancement in tinnitus and hyperacusis and, most importantly, the development of novel treatments for these disorders.

Keywords: central gain enhancement; homeostatic plasticity; hyperacusis; lateral inhibition; tinnitus.


Figures

Figure 1
Figure 1
Gain enhancement in the central auditory system. (A) Schematic showing the general anatomical organization of the auditory system. The nuclei and areas of the auditory system are highlighted in blue. The ascending anatomical projections are depicted with solid blue lines whereas the dotted blue lines represent descending projections. Limbic regions that respond to auditory stimuli and display some evidence of central gain enhancement are highlighted in green. (B) Schematics of intensity-level functions collected from the auditory nerve (AN), cochlear nucleus (CN), inferior colliculus (IC), and auditory cortex (AC). The black lines represent baseline intensity-level functions. Cochlear damage via noise or ototoxic drug exposure results in depression of sound-evoked responses in lower auditory structures (blue lines) but results in enhancement of suprathreshold responses in higher areas (red lines), despite thresholds being shifted (black arrows). SOC, superior olivary complex; VCN, ventral cochlear nucleus; DCN, dorsal cochlear nucleus; IC, inferior colliculus; MGB, medial geniculate body; AC, auditory cortex.
Figure 2
Figure 2
Relationship between electrophysiological and behavioral threshold shifts. (A) Schematic showing temporary threshold shifts in adult chinchillas that were exposed to an octave band noise centered at 4 kHz with 86 dB SPL amplitude for 5 days. Electrophysiological recordings of auditory nerve fibers revealed thresholds shifts of up to 70 dB SPL at characteristic frequencies between 4 and 11 kHz (black dots). However, behavioral audiograms (red line) revealed relatively smaller behavioral threshold shifts in comparison, ranging from 5 to 20 dBs SPL at frequencies between 4 and 11 kHz. (B) Cochleogram showing narrow lesions of inner (dotted red line) and outer hair cells (black line) over the 1 mm that correlated with the frequency of the electrophysiological and behavioral threshold shifts [modified from Ref. (48)].
Figure 3
Figure 3
Origins of central gain enhancement. Schematized data for amplitude-level functions to a 1 kHz tone chronically recorded from chinchillas at the round window (CAP), cochlear nucleus (CN), and inferior colliculus (IC), before (black lines) and 24 h after (red lines) noise-exposure of 105 dB SPL at 2.8 kHz for 2 h. Green arrows indicate the direction of amplitude change after noise-exposure. Responses are normalized to maximum response before the noise-exposure [modified from Ref. (57)].
Figure 4
Figure 4
Temporal dynamics of central gain enhancement. Schematized data representing the temporal dynamics of noise-induced changes to amplitude-level functions in response to click stimuli from the (A) compound action potential (CAP), (B) inferior colliculus (IC), and (C) auditory cortex (AC). The amplitude-level functions were computed from chronic recordings of CAP and LFPs from the IC and AC before (black lines), 1 h (red lines), 1 day (yellow lines), and 1 week (green lines) post-noise-exposure. The parameters for noise-exposure were white broadband noise at 115 dB SPL for 1 h [modified from Ref. (72)].
Figure 5
Figure 5
Spectral profile of central gain enhancement. Schematized data representing the amplitude-level functions before (solid lines) and after (dotted lines) restricted high-frequency hearing loss in the inferior colliculus (IC) and auditory cortex (AC). (Bottom) The tonotopic organization of the cochlea is depicted in the rainbow color spectrum with orange colors of the spectrum representing low-frequencies, green colors representing middle frequencies, and blue colors representing high-frequencies. (Middle) In the IC, high-frequency hearing loss results in increased threshold and depressed amplitude-level functions in the tonotopic region corresponding to the region of hearing loss (blue), while suprathreshold responses are enhanced at low and middle frequencies (orange and green, respectively). (Top) In contrast, amplitude-level functions from the AC are enhanced in the region of hearing loss (blue) while relative unchanged at low (orange) and middle (green) frequencies.
Figure 6
Figure 6
Carboplatin-induced changes to peripheral and central auditory system. Schematic representation of the effects of carboplatin treatment (30 mg/kg) on (A) hair cell loss, and amplitude-level functions from the (B) compound action potential (CAP), (C) inferior colliculus (IC), and (D) auditory cortex (AC). (A) Mean cochleogram showing the effects of carboplatin on OHC (gray lines) and IHC (black lines). While relatively little OHC loss was observed, an average of 30% of IHC are lost across the frequency-place map. (B–D) amplitude-level functions measured at 1 kHz before (black lines) and after (red lines) carboplatin treatment [modified from Ref. (102)].
Figure 7
Figure 7
Model of excitatory and inhibitory receptive field overlap in the auditory system. (A) Under control conditions there is strong inhibition (purple) at edge of the characteristic excitatory (green) frequency. At frequencies where the threshold for inhibition is equal to or lower the threshold for excitation, the response of the neuron is inhibited, resulting in narrow excitatory tuning curves. (B) Noise-exposure that causes restricted cochlear damage above the excitatory characteristic frequency results in the loss of this side-band inhibition, resulting in broader excitatory tuning curves.
Figure 8
Figure 8
Model of the effects of loss of lateral inhibition on rate-level functions from single-unit recordings in the inferior colliculus. (Bottom) Tonotopic projections from the cochlea result in excitatory responses of corresponding frequency regions in the inferior colliculus (IC) (cochlear nucleus is not represented for clarity). In addition to excitatory projections (semi-circles), there are inhibitory projections (flat lines) to neighboring frequencies resulting in lateral inhibition. High-frequency hearing loss results in both the loss of excitatory projections to the corresponding tonotopic region in the IC as well as loss of inhibitory projections to surround frequencies (dotted lines). (Top) Normally, increasing sound intensity results in recruitment of lateral inhibitory projections so that many cells in the IC have non-monotonic rate-level functions (solid lines). High-frequency noise-damage not only results in decreased rate-level functions in the region of hearing loss (dotted blue line) but enhanced rate-level functions and increased monotonicity due to loss of lateral inhibition at edge frequencies (dotted orange and green lines). This loss of lateral inhibition and increase in monotonic rate-level functions could contribute to the enhancement of amplitude-level functions observed at frequencies outside of hearing loss region in the IC (see Figure 5).

Similar articles

Cited by

References

    1. Rybak LP, Ramkumar V. Ototoxicity. Kidney Int (2007) 72:931–5.10.1038/sj.ki.5002434 - DOI - PubMed
    1. Baguley DM. Hyperacusis. J R Soc Med (2003) 96:582–5.10.1258/jrsm.96.12.582 - DOI - PMC - PubMed
    1. Hoffman HJ, Reed GW. Epidemiology of tinnitus. In: Snow J, editor. Tinnitus Theory and Management. Hamilton, ON: BC Decker; (2004). p. 16–41
    1. Baguley D, McFerran D, Hall D. Tinnitus. Lancet (2013) 382:1600–7.10.1016/S0140-6736(13)60142-7 - DOI - PubMed
    1. Shargorodsky J, Curhan GC, Farwell WR. Prevalence and characteristics of tinnitus among US adults. Am J Med (2010) 123:711–8.10.1016/j.amjmed.2010.02.015 - DOI - PubMed

LinkOut - more resources