. 2014 Nov 11;9(11):e111851.
doi: 10.1371/journal.pone.0111851. eCollection 2014.

NET23/STING promotes chromatin compaction from the nuclear envelope

Affiliations

NET23/STING promotes chromatin compaction from the nuclear envelope

Poonam Malik et al. PLoS One. .

Abstract

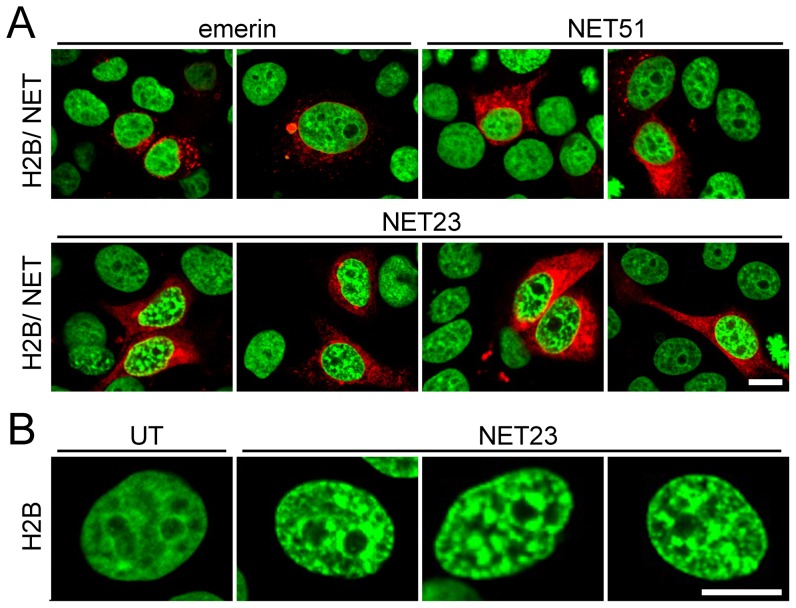
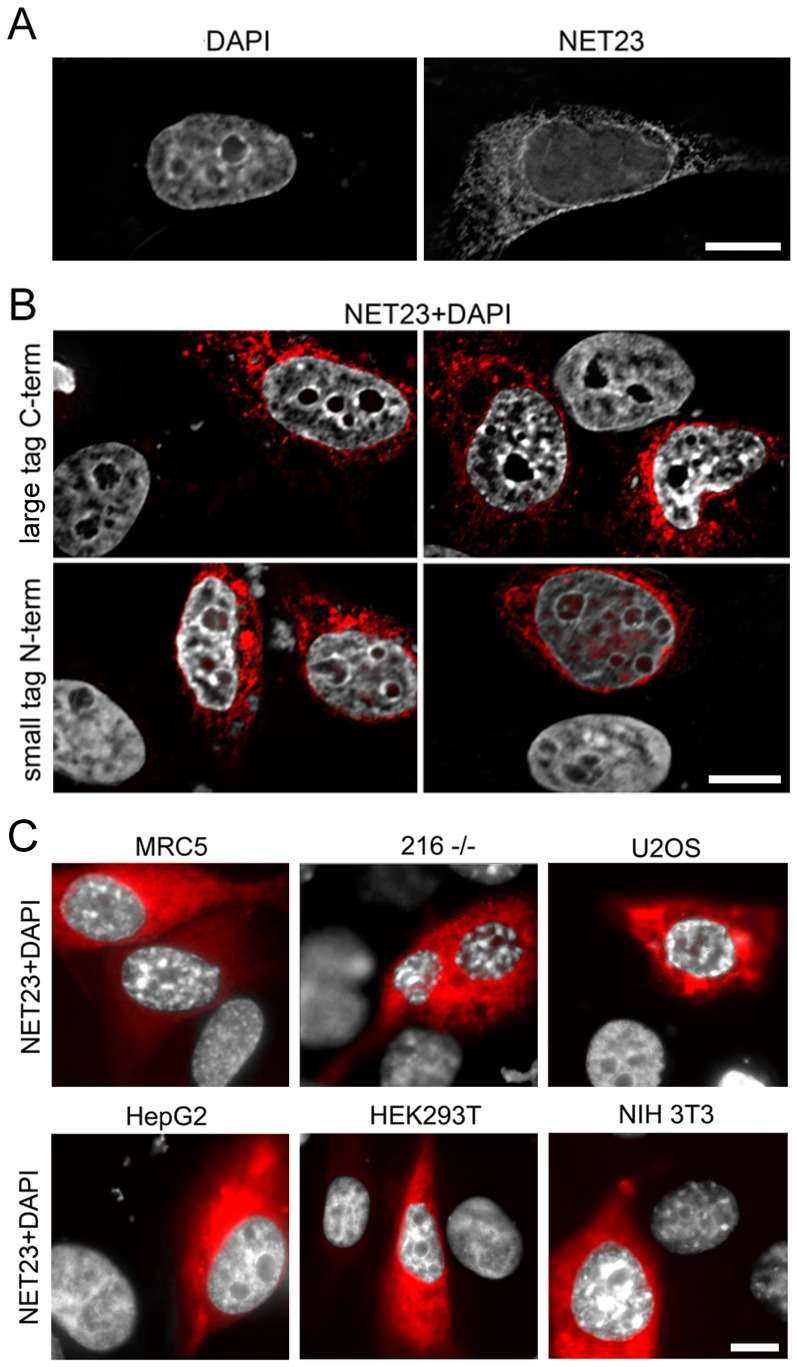
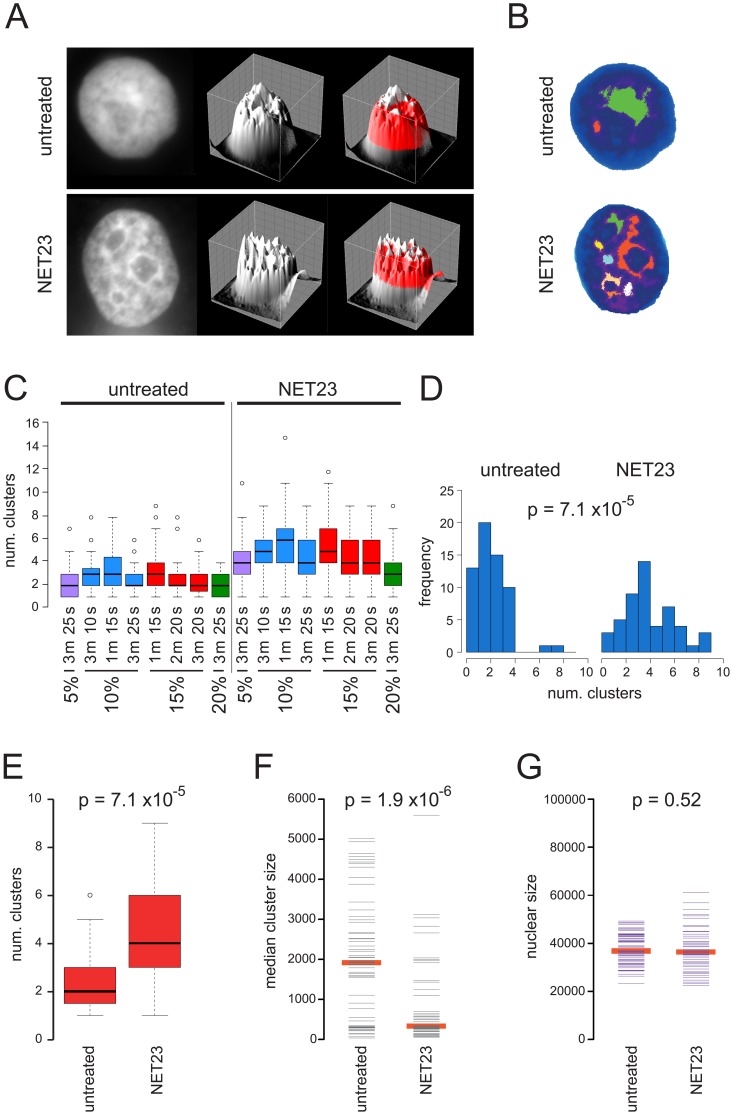
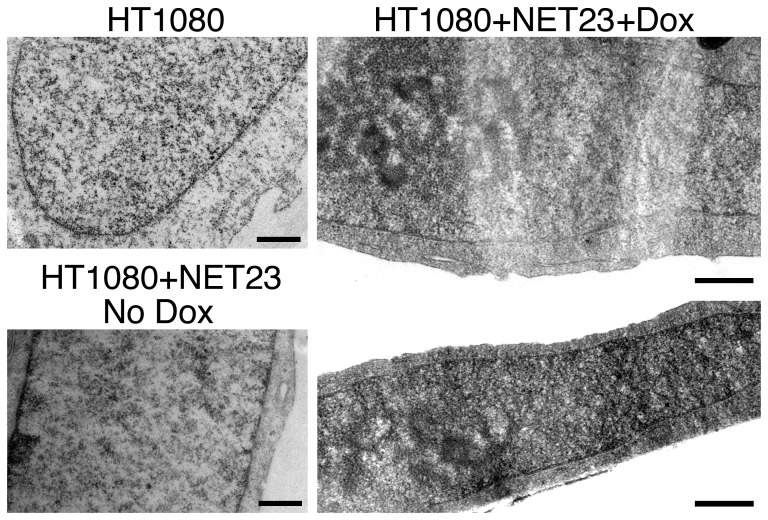
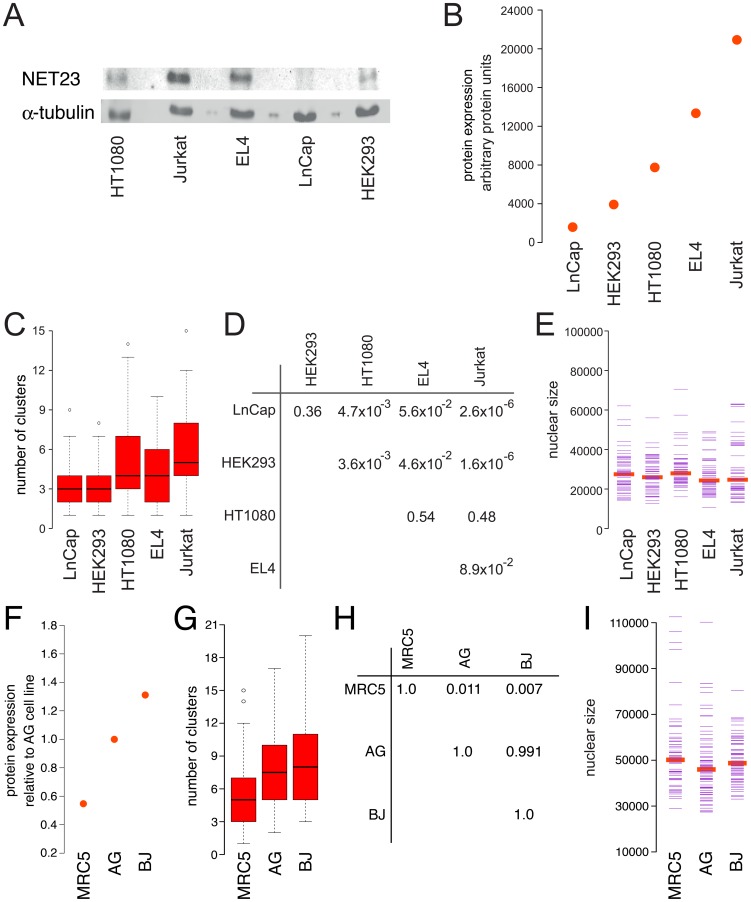
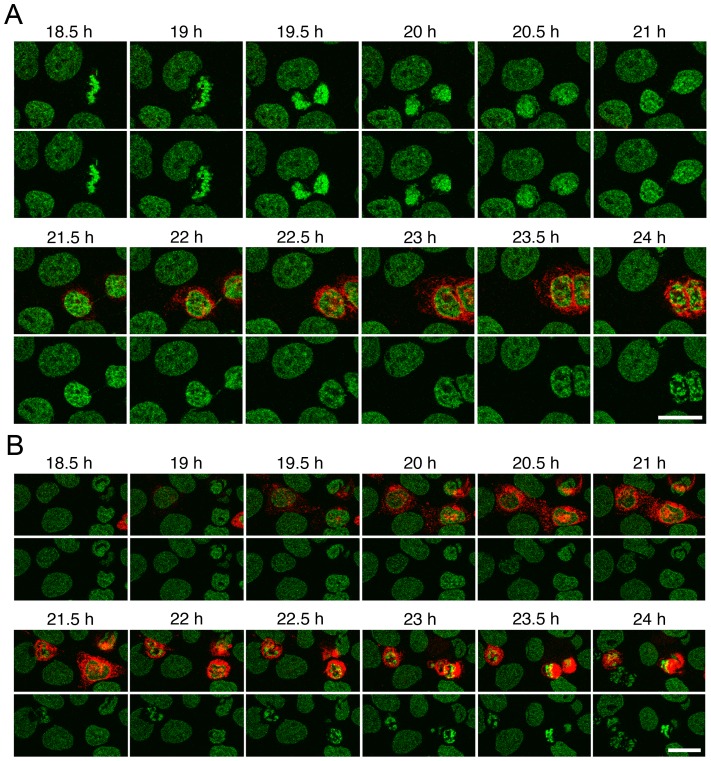
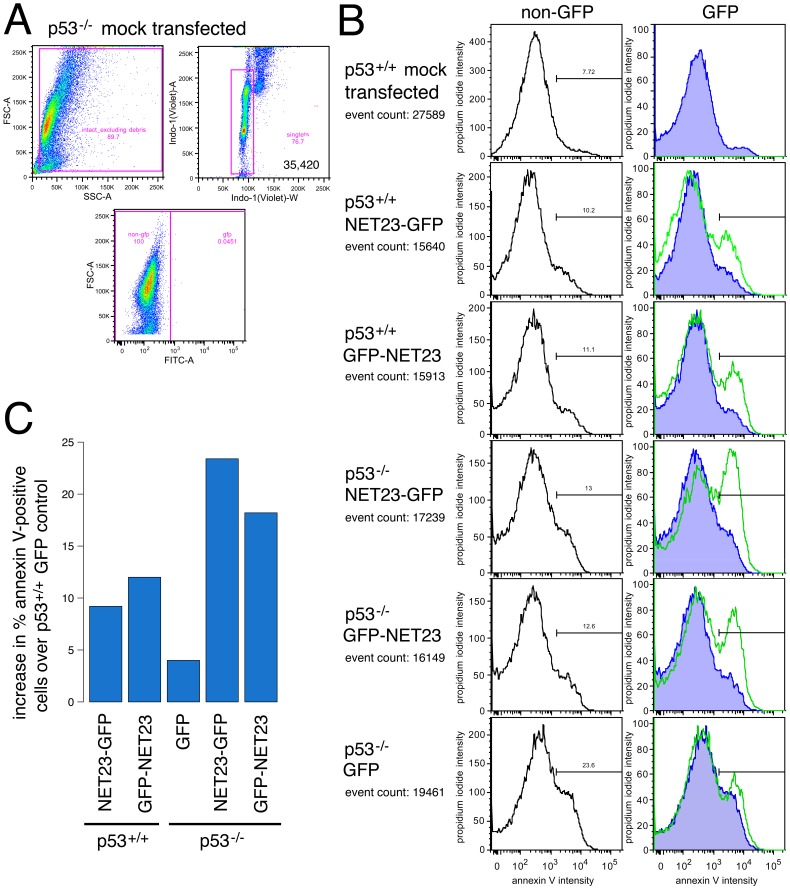
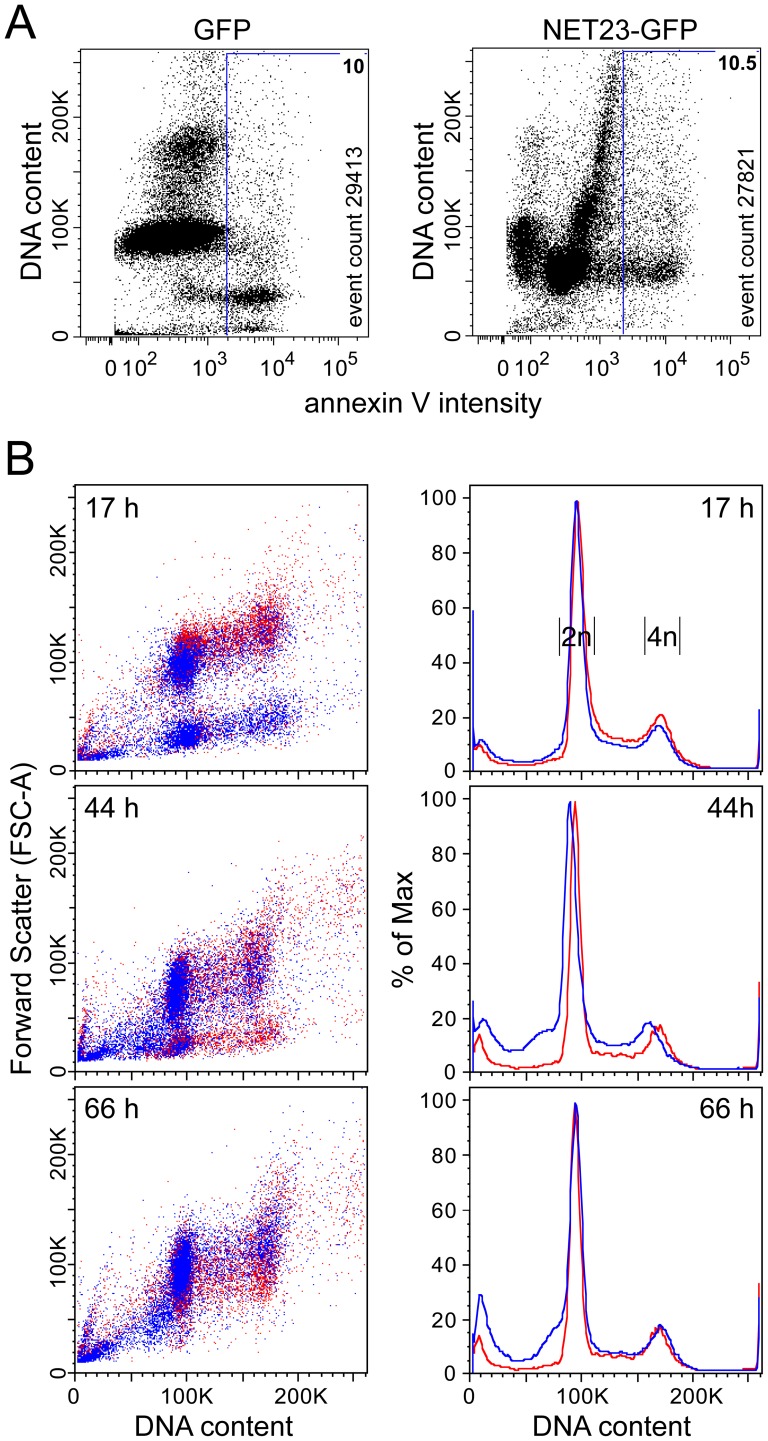
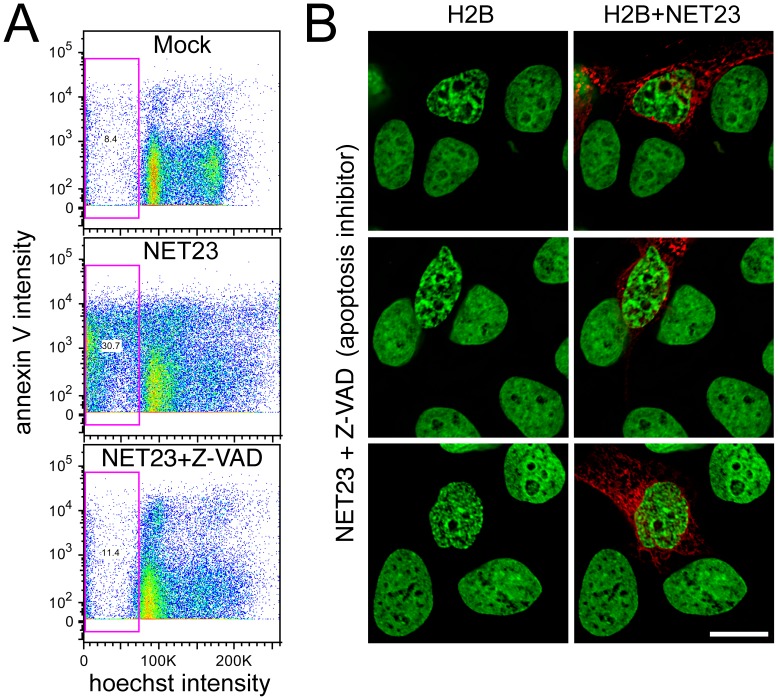
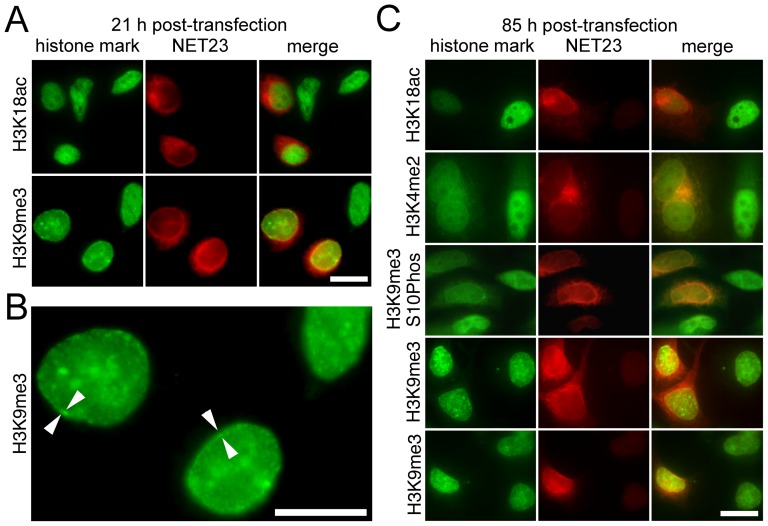
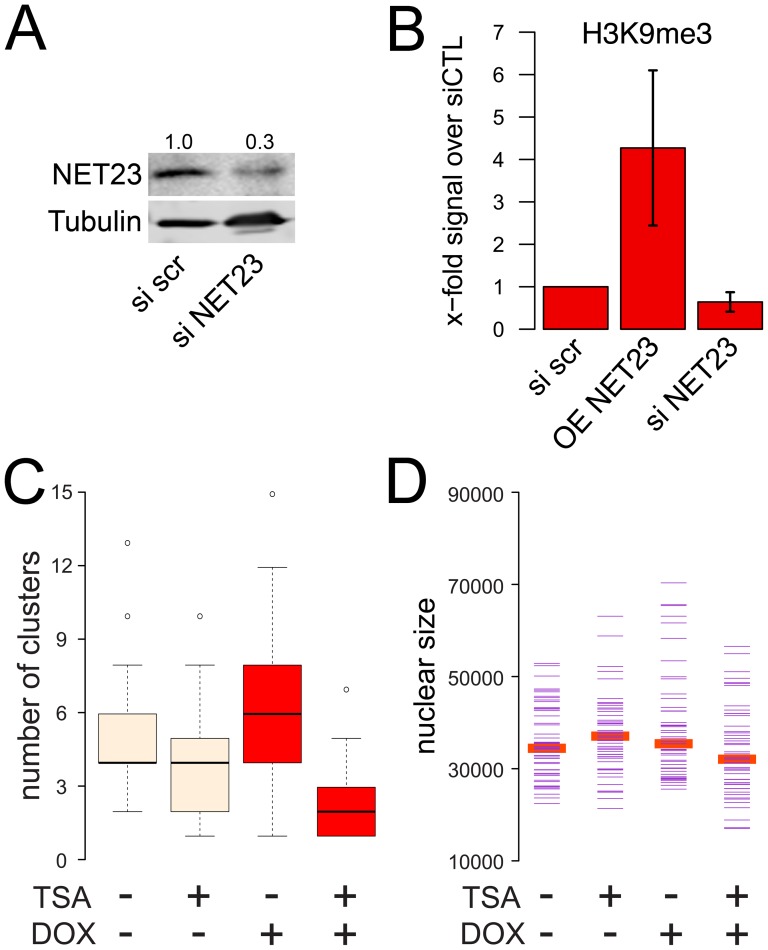
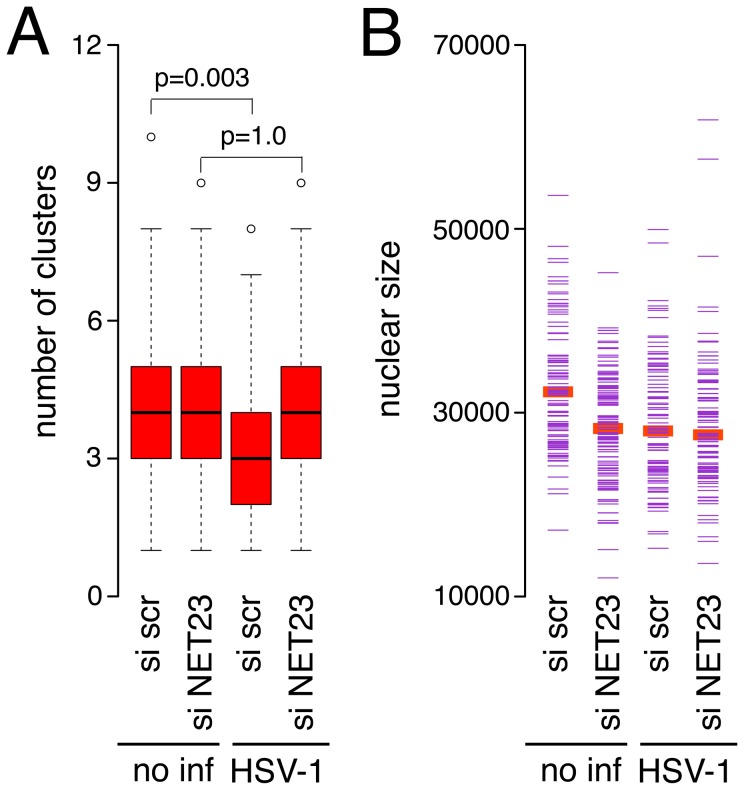
Changes in the peripheral distribution and amount of condensed chromatin are observed in a number of diseases linked to mutations in the lamin A protein of the nuclear envelope. We postulated that lamin A interactions with nuclear envelope transmembrane proteins (NETs) that affect chromatin structure might be altered in these diseases and so screened thirty-one NETs for those that promote chromatin compaction as determined by an increase in the number of chromatin clusters of high pixel intensity. One of these, NET23 (also called STING, MITA, MPYS, ERIS, Tmem173), strongly promoted chromatin compaction. A correlation between chromatin compaction and endogenous levels of NET23/STING was observed for a number of human cell lines, suggesting that NET23/STING may contribute generally to chromatin condensation. NET23/STING has separately been found to be involved in innate immune response signaling. Upon infection cells make a choice to either apoptose or to alter chromatin architecture to support focused expression of interferon genes and other response factors. We postulate that the chromatin compaction induced by NET23/STING may contribute to this choice because the cells expressing NET23/STING eventually apoptose, but the chromatin compaction effect is separate from this as the condensation was still observed when cells were treated with Z-VAD to block apoptosis. NET23/STING-induced compacted chromatin revealed changes in epigenetic marks including changes in histone methylation and acetylation. This indicates a previously uncharacterized nuclear role for NET23/STING potentially in both innate immune signaling and general chromatin architecture.


Conflict of interest statement

Competing Interests: The authors have declared that no competing interests exist.

Figures

Figure 1
Figure 1. A screen for NETs that alter chromatin compaction.
(A) 72 h post-transfection HeLa cells have no gross changes in distribution of H2B-GFP (green) when most NETs fused to mRFP (red) are exogenously expressed (e.g. emerin and NET51, upper panels). However, cells transfected with NET23/STING (lower panels) exhibit considerable chromatin compaction. (B) Zoomed images of chromatin in untransfected (left) and NET23 transfected cells. All images were taken using identical settings and all scale bars  = 10 µm.
Figure 2
Figure 2. The NET23/STING chromatin compaction effect does not depend on H2B-GFP or the epitope tag used and occurs in a wide range of cell types.
(A) Though at later times (72 h post-transfection) the compacted chromatin in the H2B-GFP HeLa cells was distributed throughout the nucleus ( Figure 1 ), at 21 h post-transfection a large percentage of the compacted chromatin could be observed at the nuclear periphery. In this case, the compaction shown was visualized using DAPI to stain the DNA that yielded similar changes as observed for the H2B-GFP signal, indicating that outputs in subsequent experiments using other cell lines without the H2B-GFP could be compared. (B) The effect of NET23/STING is independent of the epitope tag used. NET23/STING with a large C-terminal mRFP tag (upper panels) or a small N-terminal HA tag (lower panels) both yielded the chromatin compaction phenotype in the H2B-GFP HeLa cells, again using DAPI staining to visualize the DNA. The NET is shown in red and the DAPI staining for DNA in grey. (C) The chromatin compaction phenotype of NET23/STING was not cell type dependent as the effect could be observed in MRC5 primary human lung fibroblasts, 216−/− lamin A knockout mouse embryonic fibroblasts, U2OS human osteocarcinoma cells, HepG2 human liver cancer cells, HEK/293T human embryonic kidney cells, and NIH3T3 mouse fibroblasts. Again, the NET23/STING is shown in red and the DAPI staining for DNA in grey. All scale bars  = 10 µm.
Figure 3
Figure 3. An algorithm for measuring chromatin compaction.
(A) Pixel intensities from images obtained using identical microscope and camera settings were plotted topographically. A plane slicing through the topographic map at a particular percentage of the total intensity reveals only a small number of high intensity pixel clusters for untransfected cells while several high intensity pixel clusters can be observed for NET23/STING transfected cells. (B) Each high intensity pixel cluster for a particular plane in the cells shown in A is color-coded to visualize how accurately the algorithm distinguishes individual clusters. In setting the algorithm this step was used to optimize the parameters for numbers of pixels between clusters that would result in a merging of the clusters. (C) Several different parameterizations are able to distinguish between untransfected and NET23/STING transfected cells. A range of pixel intensity cutoffs for the plane are tested from 5–20% total pixel intensity (%). Also the number of pixels connecting clusters before merging them (m) and the minimum cluster size in pixels (s) were varied. This confirmed that the algorithm is robust and unbiased as statistically significant differences between the untransfected and NET23/STING transfected cells could be observed for nearly all parameters tested. (D) Histogram showing the shift in the distribution of the number of clusters between untransfected and NET23/STING transfected cells at the final parameters chosen: 15% signal intensities, 20 pixel minimum cluster size, and 3 connecting pixels required for merging. (E) Box and whiskers plot showing the distribution for the data in D and p-value calculated using a Kolmogorov-Smirnov (KS) test. (F) The same parameterization with plotting instead the cluster size medians. A similarly strong difference is observed with p-value calculated using a KS test. (G) Nuclear size was also measured for the cells analyzed and found to not change between the untransfected and NET23/STING transfected cell populations.
Figure 4
Figure 4. Chromatin compaction in NET23/STING overexpressing cells as visualized by electron microscopy.
Panels on the right are for the HT1080 parent cell line and its uninduced progeny (HT1080+NET23 No Dox) carrying the integrated NET23/STING construct. Panels on the left are cells induced with doxycycline for NET23/STING expression for overnight prior to fixation for electron microscopy. Scale bars are 0.5 µm.
Figure 5
Figure 5. Endogenous NET23/STING expression correlates with levels of normal chromatin compaction observed in various cell types.
(A–E) Transformed cell lines. (A) Western blot comparing levels of NET23/STING in different cell lines with α-tubulin used as a loading control. (B) Quantification of NET23/STING levels from three separate Western blots. The endogenous levels of NET23/STING have been corrected for α-tubulin levels and ordered from lowest to highest. (C) Using the algorithm described in Figure 3 to determine endogenous levels of chromatin compaction in the same cell lines, similarly ordered, reveals a general trend that cells with higher endogenous levels of NET23/STING have higher levels of chromatin compaction. (D) Table showing p-values for C, comparing all possible combinations using KS tests. (E) Nuclear size was also tested for each cell line, finding no notable differences. All p-values for nuclear size using KS tests were>0.05 with the exception of comparing HT1080 and EL-4 cells (p = 0.039) and HT1080 and Jurkat cells (p = 0.003). (F–I) Primary cell lines. (F) Basal NET23/STING protein levels for three primary cell lines relative to the AG line. (G) Cluster algorithm to determine endogenous levels of chromatin compaction based on DAPI staining. (H) P values for comparing cluster number between the different cell lines using KS tests comparing each to the others. (I) Nuclear size measured for the three primary lines to ensure that all were similar so that this parameter could not influence cluster number results.
Figure 6
Figure 6. Live cell imaging of chromatin compaction reveals the process is fast and can lead to apoptosis.
(A) Frames from movies of cells transfected with NET23/STING show the development of the chromatin compaction phenotype over time. The times shown are hours post transfection. Chromatin compaction begins at the nuclear periphery and then propagates throughout the nucleoplasm and considerable compaction is observed within 1 to 2 h from when the NET23/STING protein first appears. Note in the top movie that chromatin compaction looks distinct from that observed during apoptosis. (B) Many cells observed during live imaging yielded chromatin features and cell blebbing characteristic of apoptosis. From first appearance of NET23/STING to chromatin compaction and blebbing reminiscent of apoptosis typically took 2 to 3 h. All scale bars  = 10 µm.
Figure 7
Figure 7. NET23/STING promotes apoptosis.
(A) Gating strategy used for cells in B using forward and side scatter profiles to exclude debris followed by DNA content to determine intact singlet cells. The transfected population (expressing GFP) was identified by subsequently gating singlet cellular material on forward scatter versus GFP intensity. All cells in this experiment were analyzed at 44 h post-transfection. (B) The cells used to determine the gates were also stained for propidium iodide (PI; y-axis) and annexin V (x-axis). The traces in the left panels show the untransfected cells in the population and those in the right panels show the cells with GFP signal. The right-most green peak delineates cells with an annexin V signal of sufficient intensity to indicate cells undergoing apoptosis. As expected, for the mock-transfected culture essentially no GFP positive cells were identified and very few apoptosing cells could be observed. Expression of NET23/STING consistently increased the apoptosing population regardless of whether the tag was on the N-terminus (GFP-NET23) or the C-terminus (NET23-GFP) and the effect of NET23/STING did not require function of the master regulator p53 as apoptosis was induced in both wild-type (p53+/+) and p53 knockout (p53−/−) cells. Nonetheless, it is notable that the responses were very similar between the two NET23/STING constructs in the wild-type cells while the N-terminal tag showed a lagging apoptotic response in the p53 knockout cells. (C) The percentage of annexin V-positive cells is plotted after correction to subtract the number in the GFP control with the wild-type (p53+/+) cells. This is used as the correction for both cell lines to better indicate the effect of the p53 knockout itself on apoptosis induction.
Figure 8
Figure 8. NET23/STING chromatin effects may set the stage for a transitional state between chromatin condensation and apoptosis.
(A) Cells were taken at 23 h post-transfection and stained for DNA and the characteristic early apoptosis marker annexin V. GFP-transfected cells exhibit a normal distribution pattern with a large annexin V-negative G1 population (close to 100K) and smaller annexin V-negative G2/M population (close to 200K) and a small (∼10%) sub-G1 population that is mostly annexin V-positive. In contrast, at this early time post-transfection the NET23/STING-transfected population yields an aberrant distribution pattern with the main cell populations slightly lower than the normal G1 population, yet still slightly larger than the apoptosing sub-G1 population. This may reflect the process of chromatin condensation. (B) To investigate this population further, NET23/STING-transfected cells were analyzed over a timecourse from 17 to 66 h post-transfection. Over time the higher sub-G1 population can be observed to initially increase and then diminish as the smaller sub-G1 population increases. The density plots shown on the left plot DNA content against forward scatter to measure overall cell size/shape and thus likely give information about the shift in chromatin compaction, but these plots can be misleading about total numbers because of spots representing individual cells being printed on top of one another. In contrast, the cell cycle population plots on the right clearly show the total percentage of cells for the initial appearance of a higher sub-G1 population followed by its chasing into an apoptotic smaller/fragmented sub-G1 population.
Figure 9
Figure 9. NET23/STING chromatin effects are independent of apoptosis and result in an increase in G2/M.
(A) Untransfected cells (Mock), NET23-GFP transfected cells, and NET23-GFP transfected HT1080 cells treated with 20 µM of the pan-caspase inhibitor Z-VAD were stained for DNA content with the permeable dye Hoechst 33342 and the characteristic early apoptosis marker annexin V. The total sub-G1 population is gated (pink box) and anything above roughly 103 should be positive for annexin V. Both the lower sub-G1 population and most of the annexin V staining of the NET23-GFP population are absent from the Z-VAD treated population. (B) HT1080 cells were similarly treated, fixed and stained for DNA for microscopy. Despite the blocking of apoptosis pathways with the pan-caspase inhibitor, the chromatin compaction still occurred in the NET23/STING transfected cells. Scale bars  = 10 µm.
Figure 10
Figure 10. Epigenetic marks associated with heterochromatin coincide with the compacted chromatin at the nuclear periphery.
Cells were fixed at various times post-transfection with NET23/STING and stained for various epigenetic marks, particularly the active marks histone H3 acetylation at lysine 18 (H3K18Ac) and di-methylation at lysine 4 (H3K4me2), the silent mark histone H3 trimethylation at lysine 9 (H3K9Me3) and the strongly repressed mark combined H3K9me3 and S10ph. (A) At 21 h post-transfection no change in the H3K18Ac was observed; however an increase in H3K9Me3 was already visually observable by immunofluorescence microscopy. (B) The chromatin compaction effects begin at the nuclear periphery. Higher magnification field from panel A. At 21 h post-transfection only a small amount of internal H3K9Me3 signal was observable while most was enriched at the NE (arrowheads). (C) At 85 h post-transfection both a loss of acetylation at K18 and methylation at K4 were observed indicating a general loss of active marks. At the same time a strong increase in methylation at K9 was visually observable by immunofluorescence microscopy, consistent with increased silencing. The H3K9me3 was seen throughout the whole nucleoplasm though some concentration at the NE could often be observed. However, the stronger repression mark H3K9me3 combined with S10ph was actually reduced in the NET23/STING transfected cells. All scale bars  = 10 µm.
Figure 11
Figure 11. Modulation of NET23/STING levels changes levels of epigenetic marks and the chromatin compaction is reversible by treatment with TSA, a deacetylase inhibitor.
(A) Knockdown of NET23/STING. HT1080 cells were treated with either siRNA oligos for NET23/STING or a scramble control siRNA oligo. With this treatment NET23/STING protein levels could be reduced to 30% of initial levels at 4 d post-transfection. (B) Cell lysates were generated from a population of HT1080 cells either treated with the scramble control or NET23/STING siRNAs or a stably-transfected HT1080 line induced to express NET23/STING with doxycycline. Staining for the total levels of the H3K9me3 mark in these populations revealed that overall levels of H3K9 methylation were increased roughly 4-fold by exogenous expression of NET23/STING while overall levels appeared to be slightly reduced in the NET23/STING knockdown cells. The average from 3 experiments is shown with standard deviations. (C–D) The stably-transfected inducible NET23/STING cell line was either not treated or treated with 1 µg/ml of the histone deacetylase inhibitor TSA with or without induction of exogenous NET23/STING by doxycycline (DOX). (C) The number of high-intensity pixel clusters measured with the unbiased chromatin compaction algorithm is shown. NET23/STING induction increases the number of clusters while TSA completely reverses this effect. (D) Nuclear size was also quantified, revealing that neither doxycycline nor TSA treatment yielded any noticeable effect on nuclear size.
Figure 12
Figure 12. Effect of NET23/STING knockdown on chromatin changes in HSV-1 infected cells.
(A) Three days after control siRNA or NET23/STING siRNA treatment to deplete NET23/STING protein levels as in Figure 11, cells were infected with HSV-1 for 2 h at MOI 5 to induce innate immune responses. The cells were fixed, stained with DAPI and analyzed with the cluster algorithm. P-values using KS tests to compare the HSV-1 infected cells between the NET23/STING conditions are given. The p value for comparing the two HSV-1 infected populations is p<0.001. (B) Analysis of nuclear size in the same populations indicated some differences in nuclear size in this experiment. More than 100 cells were analyzed for each condition for all parameters.

Similar articles

Cited by

References

    1. de Las Heras JI, Meinke P, Batrakou DG, Srsen V, Zuleger N, et al. (2013) Tissue specificity in the nuclear envelope supports its functional complexity. Nucleus 4: 460–477. - PMC - PubMed
    1. Maraldi NM, Capanni C, Cenni V, Fini M, Lattanzi G (2011) Laminopathies and lamin-associated signaling pathways. J Cell Biochem 112: 979–992. - PubMed
    1. Sewry CA, Brown SC, Mercuri E, Bonne G, Feng L, et al. (2001) Skeletal muscle pathology in autosomal dominant Emery-Dreifuss muscular dystrophy with lamin A/C mutations. Neuropathol Appl Neurobiol 27: 281–290. - PubMed
    1. Verga L, Concardi M, Pilotto A, Bellini O, Pasotti M, et al. (2003) Loss of lamin A/C expression revealed by immuno-electron microscopy in dilated cardiomyopathy with atrioventricular block caused by LMNA gene defects. Virchows Arch 443: 664–671. - PubMed
    1. Fidzianska A, Toniolo D, Hausmanowa-Petrusewicz I (1998) Ultrastructural abnormality of sarcolemmal nuclei in Emery-Dreifuss muscular dystrophy (EDMD). J Neurol Sci 159: 88–93. - PubMed

Publication types