. 2015 May;9(5):1235-45.
doi: 10.1038/ismej.2014.215. Epub 2014 Nov 11.

Evolution of species interactions determines microbial community productivity in new environments

Affiliations

Evolution of species interactions determines microbial community productivity in new environments

Francesca Fiegna et al. ISME J. 2015 May.

Abstract

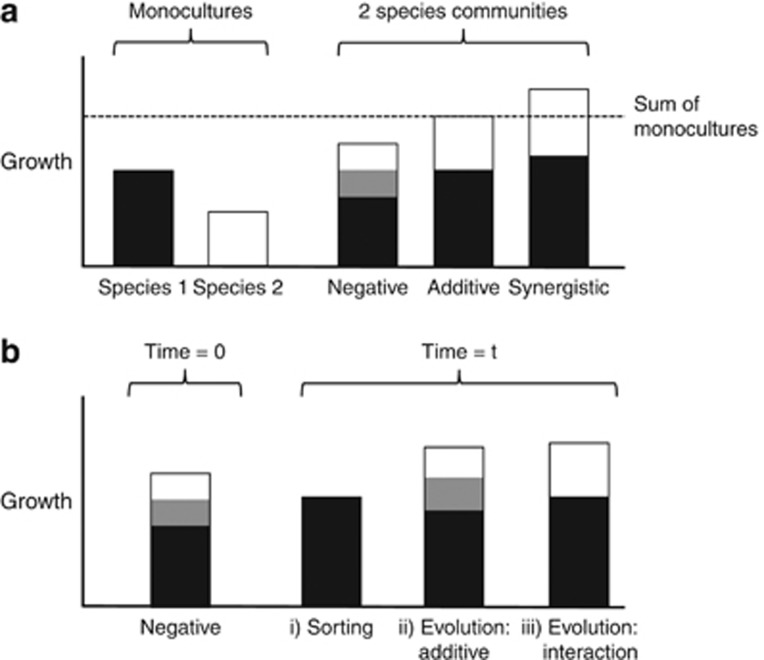
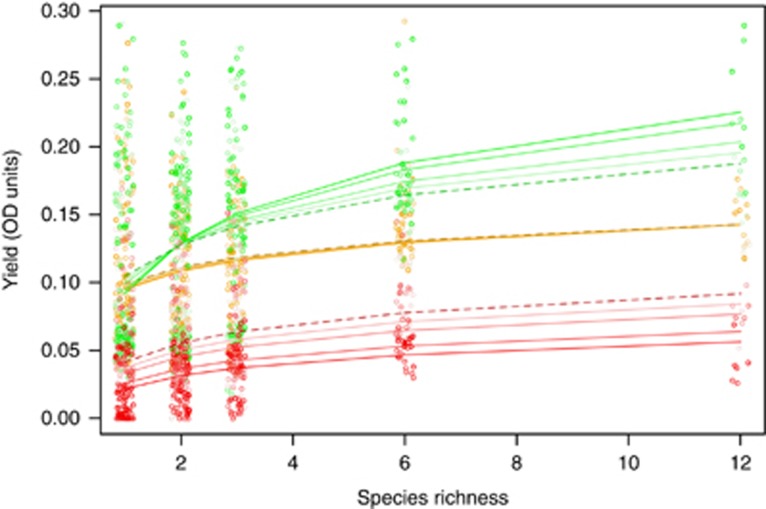
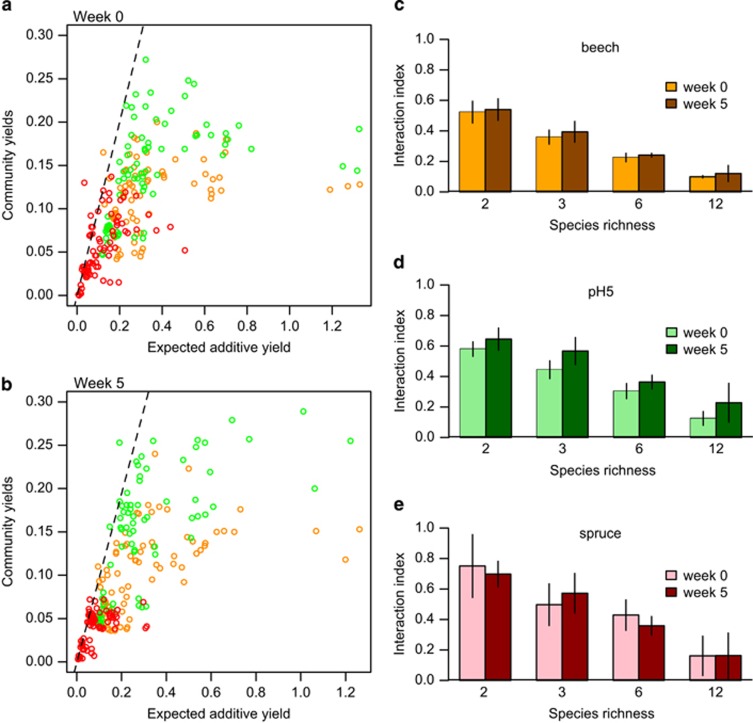
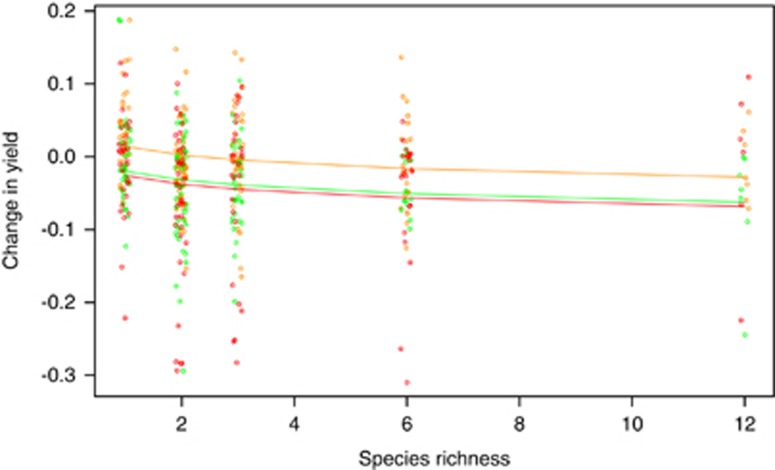
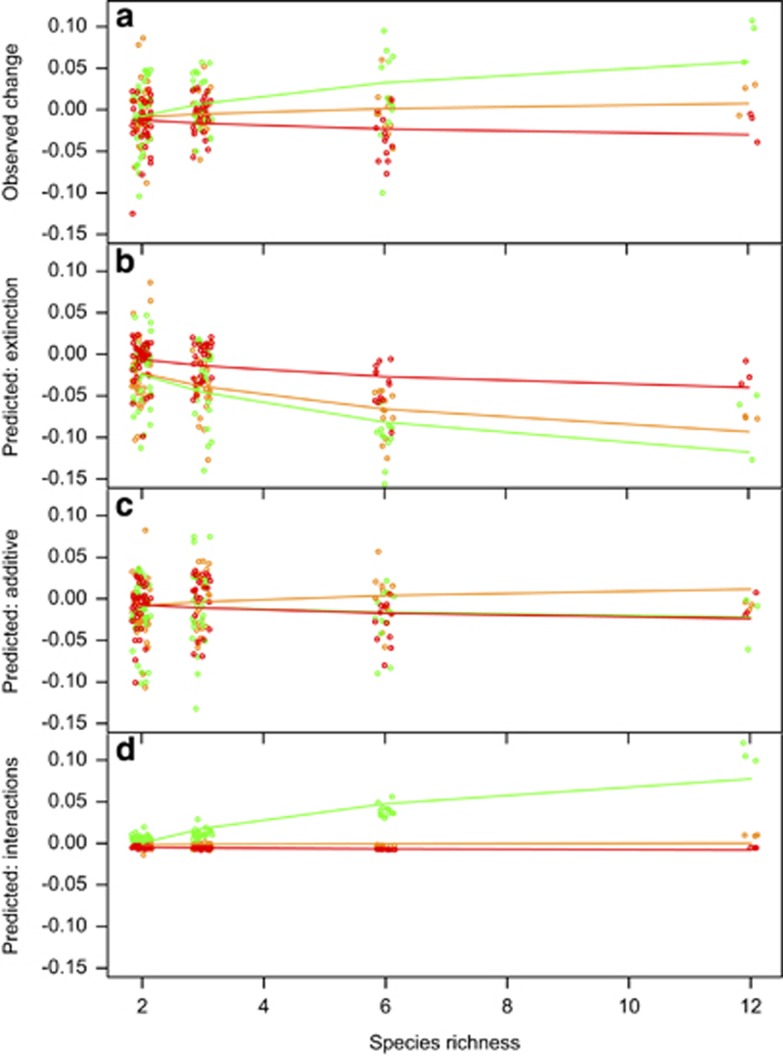
Diversity generally increases ecosystem productivity over short timescales. Over longer timescales, both ecological and evolutionary responses to new environments could alter productivity and diversity-productivity relationships. In turn, diversity might affect how component species adapt to new conditions. We tested these ideas by culturing artificial microbial communities containing between 1 and 12 species in three different environments for ∼60 generations. The relationship between community yields and diversity became steeper over time in one environment. This occurred despite a general tendency for the separate yields of isolates of constituent species to be lower at the end if they had evolved in a more diverse community. Statistical comparisons of community and species yields showed that species interactions had evolved to be less negative over time, especially in more diverse communities. Diversity and evolution therefore interacted to enhance community productivity in a new environment.


Figures

Figure 1
Figure 1
(a) Species interactions classified based on the relationship between community growth and the growth of constituent species in monoculture (Foster and Bell, 2012). Negative interactions, such as competition for shared resources, lead the community to grow worse than the sum of the species yields. Additive growth equal to the sum of monoculture growth (dashed line) is expected if species use non-overlapping resources and do not interact in other ways. Synergistic indicates that one or both species benefit so that combined growth is greater than additive. The frequency of different types will determine the shape of the relationship between community growth and species richness. Note that this classification focuses on net effects rather than mechanisms: for example, resource use, toxin production, signalling and interactions mediated by phage could all affect net interactions. (b) Community growth can change over time via three mechanisms, shown with an initially negative interaction as an example: (i) Ecological sorting occurs through the loss of one of the species, leading to lower community growth in this example; (ii) Evolution changes the growth of each species but their interaction (represented by the grey area) remains the same (which we call additive evolution; in this example growth of both species increase); (iii) Evolution alters the strength of the species interaction even if separate growths remain unchanged (in this example at time t there is no longer a negative interaction).
Figure 2
Figure 2
The relationship between yield following a serial transfer event and the number of species in a microcosm. Orange=beech tea medium; green=pH5 beech tea medium; red=spruce tea medium. The dashed lines indicate the fitted curve for yields immediately after being transferred into the different environments (that is, after 2 weeks of culturing on beech tea). Solid lines are the fitted curves for later time periods during the experiment: 1, 2, 4 and 5 weeks after transfer to the new environments respectively for increasingly darker lines. Curves become steeper over time in pH5 medium and lower over time in spruce tea.
Figure 3
Figure 3
(a) The observed yields for communities with two or more species at the start plotted against the sum of the monoculture yields of constituent species. Orange=beech tea medium; green=pH5 medium; red=spruce tea medium. The dashed line shows the 1:1 relationship. (b) The observed yields for communities with two or more species at the end plotted against the sum of the yields of constituent species measured from community isolates. The proportion of communities displaying synergistic growth did not change over time (4.0% in week 0 versus 3.6% in week 5, z=−0.25, d.f.=448, P=0.81, general linear model with binomial errors) but was significantly higher in spruce tea than the other media (9.3% communities versus 1.3% z=2.7, d.f.=446, P=0.007) and in less diverse microcosms (t=−2.4, d.f.=446, P=0.019). (c) Mean interaction index, calculated as the ratio of observed to expected additive yields, shown across richness levels and for the start and end of the experiment in beech tea. A value of 1 would be additive growth, that is, no interaction, and values of <1 indicate negative interactions. The 95% confidence intervals are shown. (d) Mean interactions in pH5 tea. (e) Mean interactions in spruce tea.
Figure 4
Figure 4
The observed (dots) and fitted (lines) yields of species isolates from communities relative to the growth rate of ancestral isolates. Orange=beech tea; green=pH5 beech tea; red=spruce tea. Species that evolved in more diverse communities have significantly lower yields (and less on average than the ancestral isolates) when subsequently grown in monoculture than those from less diverse communities.
Figure 5
Figure 5
(a) Observed changes in community yields, Ai,t=5Ai,t=0, between the start and the end of the experiment extracted from data in Figure 2. Predicted changes in community yields because of (b) species extinction from model 1 in Table 2, (c) additive evolution of species yields from model 2 and (d) systematic changes in species interactions within environment and richness treatments, calculated as predicted changes from model 4 minus predicted changes from model 2. Additive evolution reproduces the changes in control beech tea and spruce tea, but evolution of species interactions is needed to reproduce the changes in pH5 tea.

References

    1. Awasthi A, Singh M, Soni SK, Singh R, Kalra A.2014Biodiversity acts as insurance of productivity of bacterial communities under abiotic perturbations ISME Je-pub ahead of print 13 June 2014; doi:10.1038/ismej.2014.91 - DOI - PMC - PubMed
    1. Bell G. The evolution of trophic structure. Heredity. 2007;99:494–505. - PubMed
    1. Bell T, Lilley AK, Hector A, Schmid B, King L, Newman JA. A linear model method for biodiversity-ecosystem functioning experiments. Am Nat. 2009;174:836–849. - PubMed
    1. Bell T, Newman JA, Silverman BW, Turner SL, Lilley AK. The contribution of species richness and composition to bacterial services. Nature. 2005;436:1157–1160. - PubMed
    1. Brockhurst MA, Fenton A, Roulston B, Rainey PB. The impact of phages on interspecific competition in experimental populations of bacteria. BMC Ecology. 2006;6:19. - PMC - PubMed

Publication types