. 2014 Nov 12:5:5165.
doi: 10.1038/ncomms6165.

Suppression of the FOXM1 transcriptional programme via novel small molecule inhibition

Affiliations

Suppression of the FOXM1 transcriptional programme via novel small molecule inhibition

Michael V Gormally et al. Nat Commun. .

Abstract

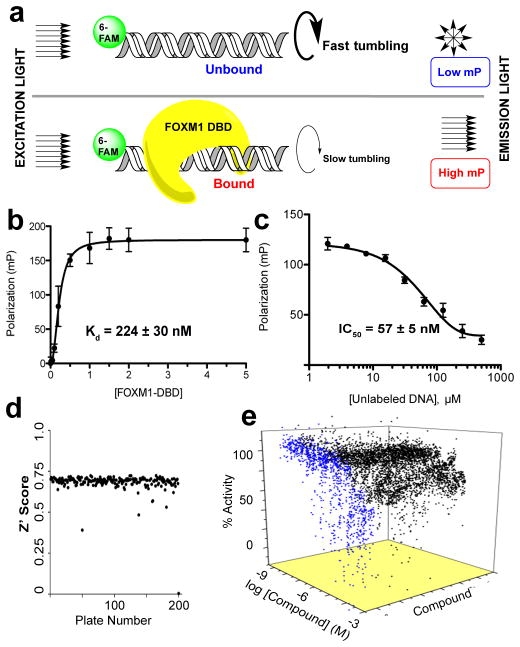
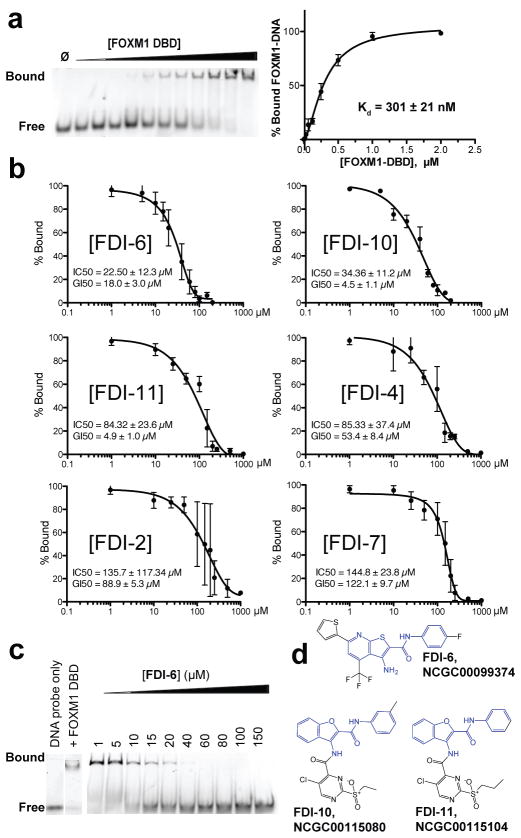
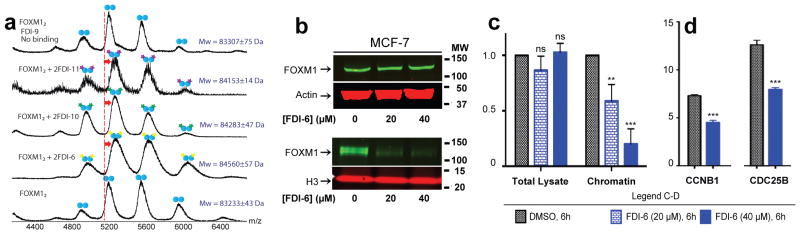
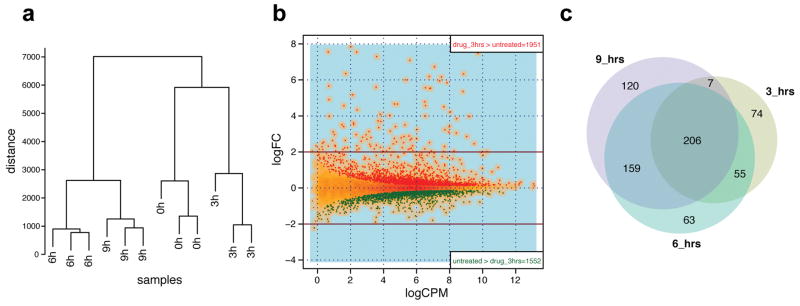
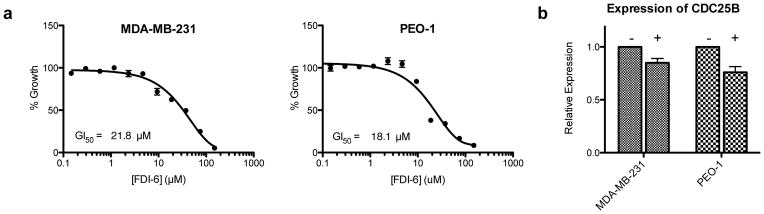
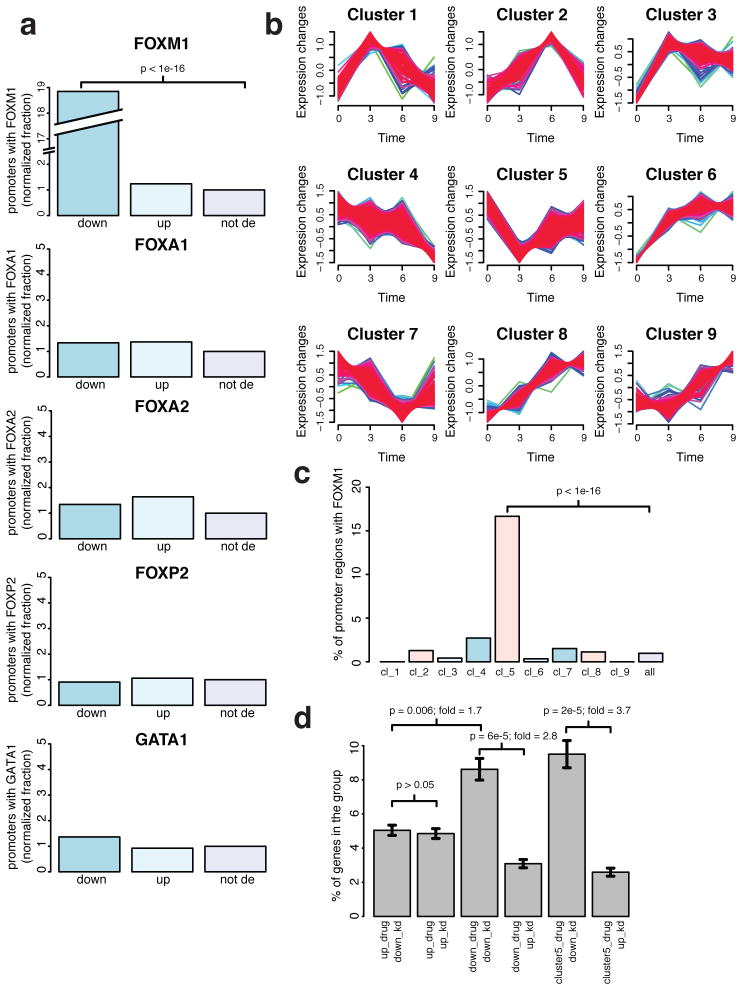
The transcription factor FOXM1 binds to sequence-specific motifs on DNA (C/TAAACA) through its DNA-binding domain (DBD) and activates proliferation- and differentiation-associated genes. Aberrant overexpression of FOXM1 is a key feature in oncogenesis and progression of many human cancers. Here--from a high-throughput screen applied to a library of 54,211 small molecules--we identify novel small molecule inhibitors of FOXM1 that block DNA binding. One of the identified compounds, FDI-6 (NCGC00099374), is characterized in depth and is shown to bind directly to FOXM1 protein, to displace FOXM1 from genomic targets in MCF-7 breast cancer cells, and induce concomitant transcriptional downregulation. Global transcript profiling of MCF-7 cells by RNA-seq shows that FDI-6 specifically downregulates FOXM1-activated genes with FOXM1 occupancy confirmed by ChIP-PCR. This small molecule-mediated effect is selective for FOXM1-controlled genes with no effect on genes regulated by homologous forkhead family factors.


Conflict of interest statement

Competing financial interests: The authors declare no competing financial interests.

Figures

Figure 1
Figure 1. Design of FP assay to screen for inhibitors of FOXM1 DNA binding
(a) Schematic of FP assay principle. Polarized light excites the fluorophore labeled DNA consensus sequence probe. The proportion of polarized light recovered upon emission is related to the total mass of the probe, thus binding of probe and FOXM1 DBD can be monitored. (b) FP reports binding of FOXM1 DBD with tagged consensus DNA. (c) Unlabeled consensus DNA efficiently displaced tagged DNA in a dose dependent manner. A large signal window (>100 mP) between bound and unbound states indicated a robust assay. (d) Z′ score for each plate in screen. Aggregate Z′ score was 0.71, indicating a highly robust assay. (e) Waterfall plot showing dose-response curves for 170 active and 907 inconclusive hits in blue and black, respectively. Data are reported as average of replicates (n=3) and error bars indicate s.d. throughout the figure.
Figure 2
Figure 2. EMSA provides orthogonal biophysical validation of 16 lead compounds from FP screen
(a) Representative EMSA image shows the association of FOXM1 DBD with its fluorescently tagged DNA consensus. Binding curve for the FOXM1 DBD-DNA interaction was determined by quantification of EMSA replicates. (b) Quantification of EMSA bands confirmed six of the 20 lead compounds selected from the FP results inhibited FOXM1 DNA binding. In rank order of potencies: FDI-6 >FDI-10 > FDI-11 > FDI-4 > FDI-2 > FDI-7. Representative gel images are provided in Supplementary concentrations in MCF-7 cells. (c) Representative Fig. 5. Each inset lists the IC50 as well as 72 h GI50 EMSA showing the inhibitory effect of FDI-6 on the FOXM1 DBD-DNA complex. (d) Structures of FDI-6, FDI-10, and FDI-11, the most potent of the validated hit compounds, which all contain a common core structural element (highlighted in blue). Data are reported as average of replicates (n=3) and error bars indicate s.d. throughout figure.
Figure 3
Figure 3. Compound FDI-6 shows promising FOXM1-specific inhibitory effects in MCF-7 cells
(a) FDI compounds were investigated for direct interaction with FOXM1 protein by nondenaturing nanoESI MS. EMSA validated hits FDI-6 (yellow stars), FDI-10 (green stars), and FDI-11 (purple stars) associate with the protein in a 1:1 stoichiometric ratio. Negative control FDI-9 was identified as a false positive by EMSA and does not associate with the protein. Mass shifts indicating ligand association are indicated by red arrows. (b) Western blots on the whole cell and chromatin fractions revealed a specific displacement of DNA bound FOXM1 while total levels were unaffected. Total MCF-7 cell lysate and chromatin bound fractions were isolated after 6 h treatment with FDI-6 or DMSO control. (c) Quantification of western blots revealed displacement of FOXM1 from DNA. Data were normalized to Actin (total lysate) and Histone H3 (chromatin fraction). (d) Targeted ChIP PCR revealed 6 h treatment with FDI-6 decreased FOXM1 occupancy at known FOXM1 target genes. Refer to legend for c-d. Data are reported as average of replicates (n=3) and error bars indicate s.d. throughout the figure. In each case the statistical significance was determined by Student’s t-test (*=P<0.05, **=P<0.01, ***=P<0.001).
Figure 4
Figure 4. Genome wide RNA-seq shows that FDI-6 treatment selectively down-regulates transcription of FOXM1 target genes
(a) Hierarchical clustering of gene expression profiles, showing the similarity of different treatment times. See Supplementary Table S2 for details of Euclidian distance between paired libraries. (b) Venn diagrams showing the overlap of differentially expressed genes at the different time points. (c) Global differential expression map of RNA-seq after 3 h treatment versus untreated. Y-axis: logarithm of fold change (logFC); X-axis: logarithm of counts per million of reads (logCPM). Red dots: up-regulated genes (n=1951); green dots: down-regulated genes (n=1552).
Figure 5
Figure 5. FDI-6 retains activity in MDA-MB-231 and PEO-1 adenocarcinoma cell lines
(a) 72 h treatment with FDI-6 shows dose dependent effect on cell growth in MDA-MB-231 and PEO-1 breast and ovarian cancer cell lines. (b) FDI-6 down-regulates CDC25B expression after 3 h treatment.
Figure 6
Figure 6. Differential expression signature of FDI-6 is associated with FOXM1 promoter occupancy and siRNA FOXM1
(a) Barplots showing the percentage of differentially expressed gene sets with a transcription factor occupancy in the promoter region (2 kb upstream of tss). Plots are shown for the closely related forkhead transcription factors FOXM1, FOXA1, FOXA2, FOXP2 as well as the transcriptional activator GATA1. For each plot, from left to right, bars represent down-regulated (down), up-regulated (up), and not differentially expressed (not de) gene sets. (b) Temporal cluster analysis grouping genes that show similar changes in expression after FDI-6 treatment. (c) Barplot showing the percentage of genes in the different temporal clusters with a FOXM1 peak in the promoter region. (d) Barplot showing the fraction of genes that were up- and down-regulated by FDI-6 and were commonly differentially expressed in an existing microarray dataset of FOXM1 siRNA knockdown. Error bars indicate s.e.m.

References

    1. Darnell JE. Transcription factors as targets for cancer therapy. Nat Rev Cancer. 2002;2:740–749. - PubMed
    1. Libermann TA, Zerbini LF. Targeting transcription factors for cancer gene therapy. Curr Gene Ther. 2006;6:17–33. - PubMed
    1. Laoukili J, Stahl M, Medema RH. FoxM1: At the crossroads of ageing and cancer. Biochimica et Biophysica Acta (BBA)- Reviews on Cancer. 2007;1775:92–102. - PubMed
    1. Vaquerizas JM, Kummerfeld SK, Teichmann SA, Luscombe NM. A census of human transcription factors: function, expression and evolution. Nature Reviews Genetics. 2009;10:252–263. - PubMed
    1. Spitz F, Furlong EEM. Transcription factors: from enhancer binding to developmental control. Nature Reviews Genetics. 2012;13:613–626. - PubMed

Publication types

MeSH terms

Associated data