. 2014 Nov 12:4:6874.
doi: 10.1038/srep06874.

Further improvements to linear mixed models for genome-wide association studies

Affiliations

Further improvements to linear mixed models for genome-wide association studies

Christian Widmer et al. Sci Rep. .

Abstract

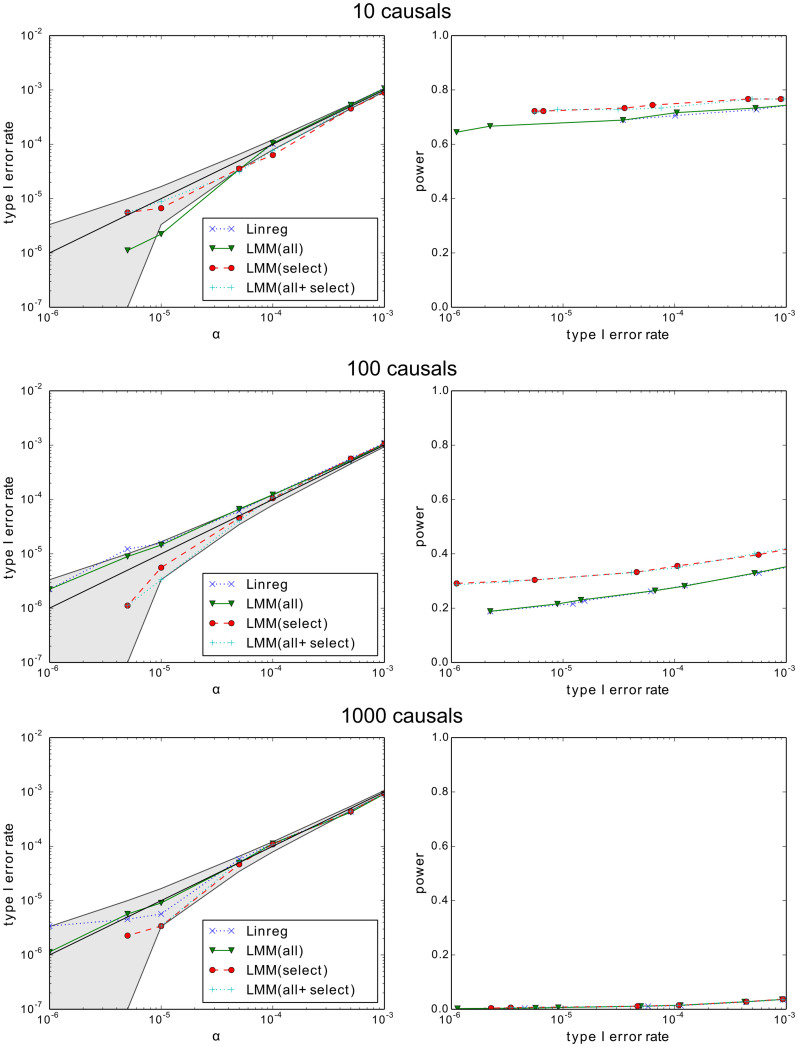
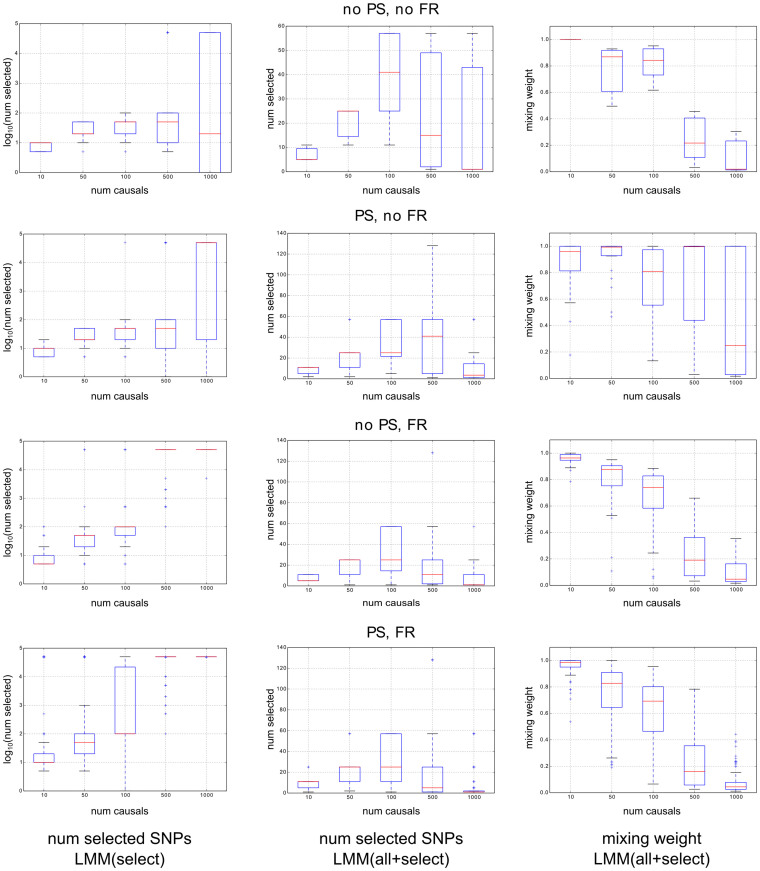
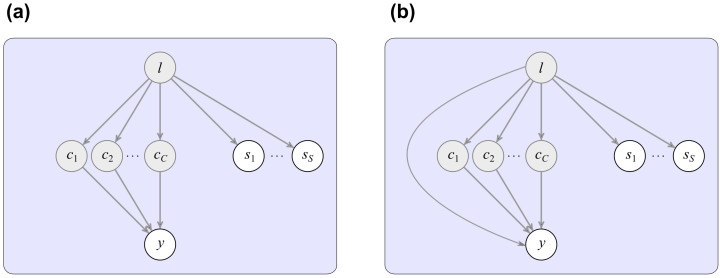
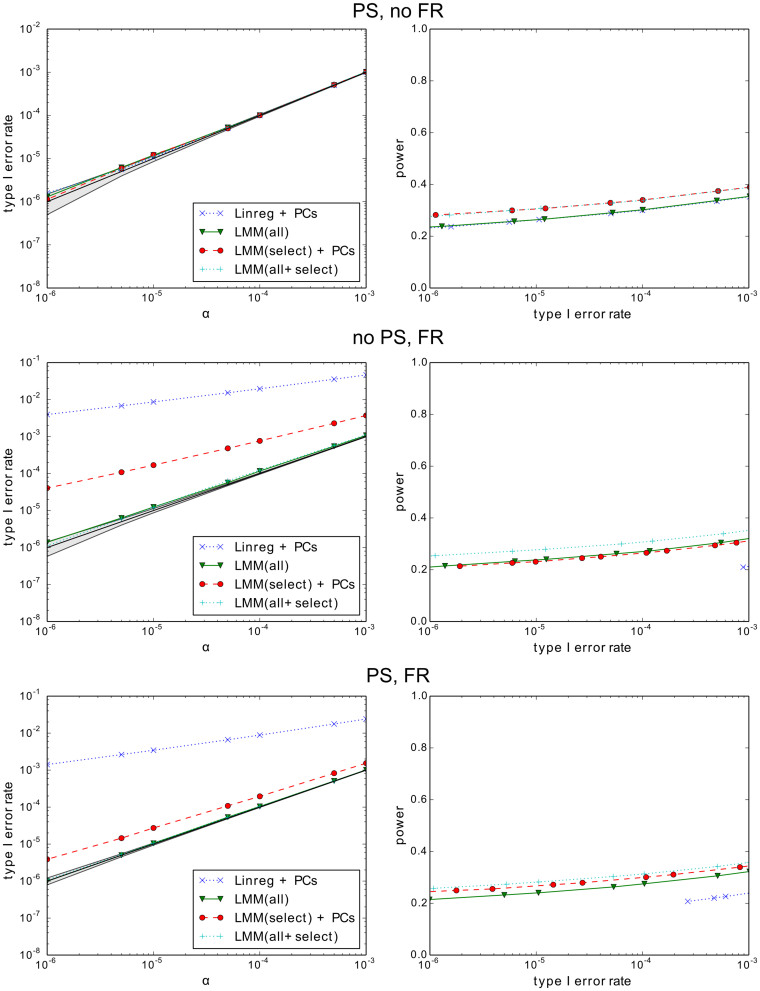
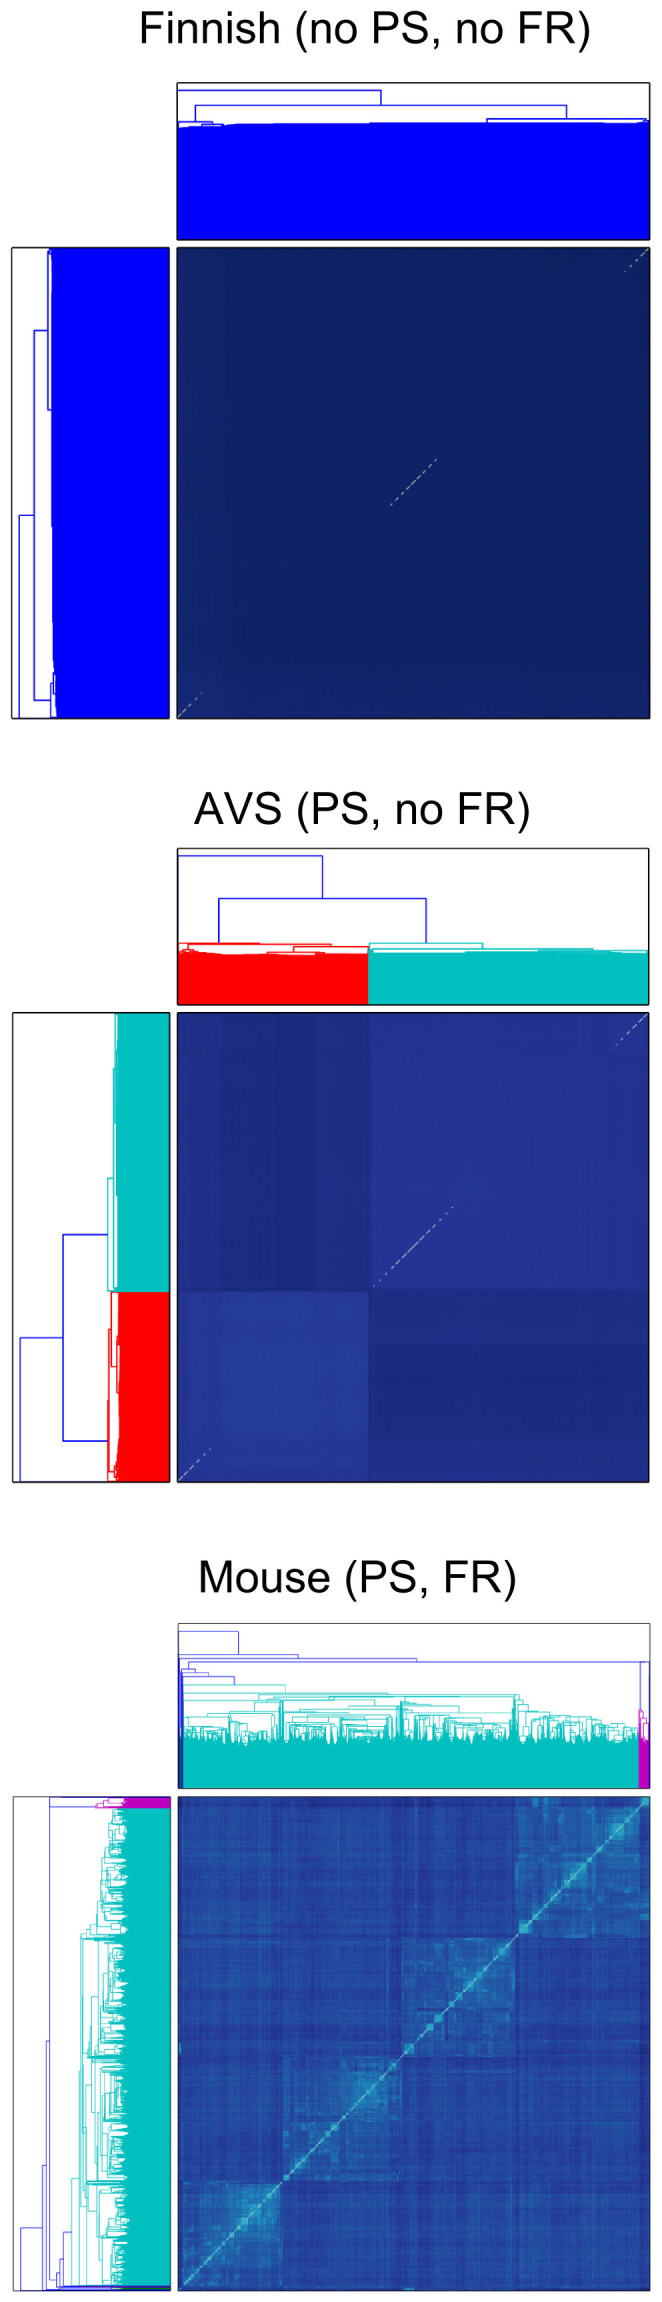
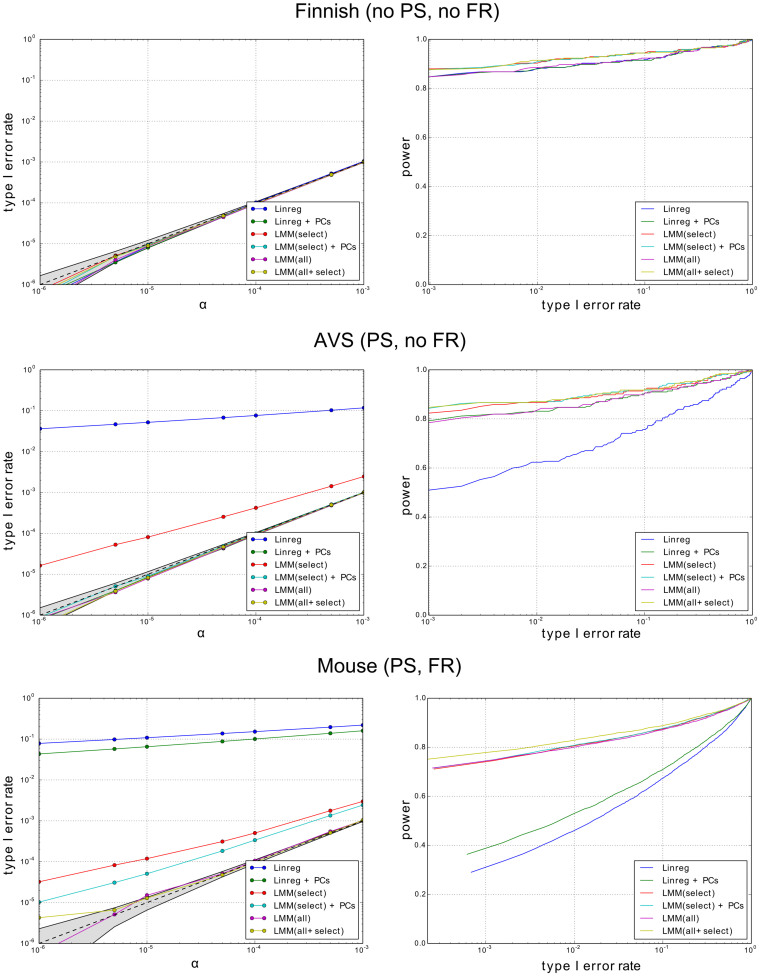
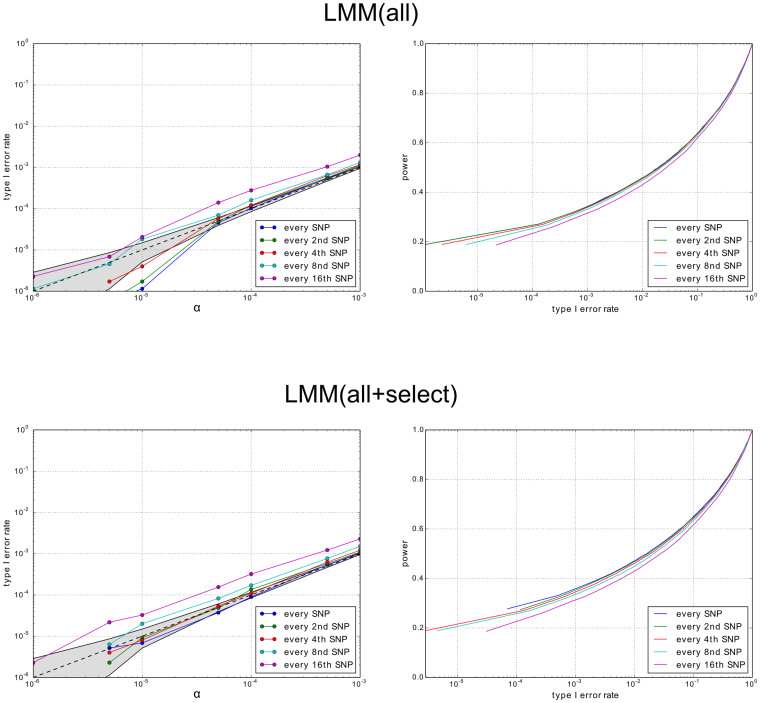
We examine improvements to the linear mixed model (LMM) that better correct for population structure and family relatedness in genome-wide association studies (GWAS). LMMs rely on the estimation of a genetic similarity matrix (GSM), which encodes the pairwise similarity between every two individuals in a cohort. These similarities are estimated from single nucleotide polymorphisms (SNPs) or other genetic variants. Traditionally, all available SNPs are used to estimate the GSM. In empirical studies across a wide range of synthetic and real data, we find that modifications to this approach improve GWAS performance as measured by type I error control and power. Specifically, when only population structure is present, a GSM constructed from SNPs that well predict the phenotype in combination with principal components as covariates controls type I error and yields more power than the traditional LMM. In any setting, with or without population structure or family relatedness, a GSM consisting of a mixture of two component GSMs, one constructed from all SNPs and another constructed from SNPs that well predict the phenotype again controls type I error and yields more power than the traditional LMM. Software implementing these improvements and the experimental comparisons are available at http://microsoft.com/science.


Conflict of interest statement

C.W., C.L., N.F., C.K., R.D., J.L., and D.H. were employed by Microsoft while performing this work.

Figures

Figure 1
Figure 1. Empirical type I error rate and power for no population or family relatedness with purely synthetic data.
Type I error rate is plotted as a function of P value cutoff α. Each point represents the average type I error rate or power across 18 data sets with different degrees of signal (narrow-sense heritability). Shading on the curves for type I error rate represent the 95% confidence interval assuming type I error is controlled. All power curves that are visibly separated have significant differences between them. For example, comparing power for Linreg and LMM(all) for 10 causal SNPs at a type I error of 10−3, the P value from a two-sided binomial test applied to the number of true positives is 0.03.
Figure 2
Figure 2. Box plots showing number of SNPs selected and mixing weight as a function of the number of causal SNPs with purely synthetic data.
The first column shows log10 of the number of SNPs selected by LMM(select). The highest point corresponds to the selection of all SNPs. The second and third columns show the number of selected SNPs and mixing weights for LMM(all + select). A mixing weight of 1 corresponds to using a GSM based only on SNP selection. A mixing weight of 0 corresponds to using a GSM based only on all SNPs.
Figure 3
Figure 3. Graphical models for the data-generation process.
The variable l is hidden (latent) and corresponds to confounding structure, either population structure of family relatedness. The variables c and s with subscripts correspond to causal and non-causal SNPs, respectively.
Figure 4
Figure 4. Empirical type I error rate and power with and without population structure (PS) and family relatedness (FR) with purely synthetic data.
Type I error rate is plotted as a function of P value cutoff α. Each point represents the average type I error rate or power across multiple data sets with varying numbers of causal SNPs and varying degrees of heritability, population structure, and family relatedness.
Figure 5
Figure 5. The GSM for three real SNP data sets.
Each point in the matrix corresponds to the similarity between a pair of individuals. Lighter colors correspond to greater similarity. The ordering was obtained by a hierarchical clustering, as indicated by the dendrograms on the axes, where different colors reflect substantially different clusters.
Figure 6
Figure 6. Empirical type I error rate and power for three real SNP data sets and synthetic phenotypes with 10 causal SNPs.
Each point represents the average type I error rate or power across multiple synthetic phenotypes (400 for Finnish and AVS, and 4,000 for Mouse). In the Finnish power plot, methods that include select have greater power than those that do not.
Figure 7
Figure 7. Empirical type I error rate and power for phenotypes synthetically generated from SNPs from the Mouse data with 10 causal SNPs.
GSMs were estimated from SNPs sampled uniformly across the genome (every kth SNP). Each point represents average type I error rate or power across 4,000 synthetic phenotypes.

References

    1. Yu J. et al. A unified mixed-model method for association mapping that accounts for multiple levels of relatedness. Nat. Genet. 38, 203–8 (2006). - PubMed
    1. Kang H. M. et al. Efficient control of population structure in model organism association mapping. Genetics 178, 1709–23 (2008). - PMC - PubMed
    1. Kang H. M. et al. Variance component model to account for sample structure in genome-wide association studies. Nat. Genet. 42, 348–54 (2010). - PMC - PubMed
    1. Lippert C. et al. FaST linear mixed models for genome-wide association studies. Nat. Methods 8, 833–5 (2011). - PubMed
    1. Listgarten J. et al. Improved linear mixed models for genome-wide association studies. Nat. Methods 9, 525–6 (2012). - PMC - PubMed

Publication types

LinkOut - more resources