. 2014 Nov 11;5(1):35-44.
doi: 10.1534/g3.114.014555.

Expression of MTAP inhibits tumor-related phenotypes in HT1080 cells via a mechanism unrelated to its enzymatic function

Affiliations

Expression of MTAP inhibits tumor-related phenotypes in HT1080 cells via a mechanism unrelated to its enzymatic function

Baiqing Tang et al. G3 (Bethesda). .

Abstract

Methylthioadenosine Phosphorylase (MTAP) is a tumor suppressor gene that is frequently deleted in human cancers and encodes an enzyme responsible for the catabolism of the polyamine byproduct 5'deoxy-5'-methylthioadenosine (MTA). To elucidate the mechanism by which MTAP inhibits tumor formation, we have reintroduced MTAP into MTAP-deleted HT1080 fibrosarcoma cells. Expression of MTAP resulted in a variety of phenotypes, including decreased colony formation in soft-agar, decreased migration, decreased in vitro invasion, increased matrix metalloproteinase production, and reduced ability to form tumors in severe combined immunodeficiency mice. Microarray analysis showed that MTAP affected the expression of genes involved in a variety of processes, including cell adhesion, extracellular matrix interaction, and cell signaling. Treatment of MTAP-expressing cells with a potent inhibitor of MTAP's enzymatic activity (MT-DADMe-ImmA) did not result in a MTAP- phenotype. This finding suggests that MTAP's tumor suppressor function is not the same as its known enzymatic function. To confirm this, we introduced a catalytically inactive version of MTAP, D220A, into HT1080 cells and found that this mutant was fully capable of reversing the soft agar colony formation, migration, and matrix metalloproteinase phenotypes. Our results show that MTAP affects cellular phenotypes in HT1080 cells in a manner that is independent of its known enzymatic activity.

Keywords: cell mobility and migration; methionine; suppressor genes.


Figures

Figure 1
Figure 1
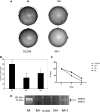
MTAP expression and activity in HT1080 cells. (A) Western blot showing levels of MTAP in extracts from stably transfected HT1080 cells. M− is the parent cell line transfected with vector alone (pTRE2). M+ has been transfected with the MTAP expressing construct pTRE2:MTAP. M+I is the identical to M+, except the cells have been treated for 72 hr with 10 μM the MTAP inhibitor, MT-DAD-Me-ImmA. Hela contains extract from a MTAP+ Hela cell. D220A contains extract from a HT1080 cell that has been transfected with a plasmid that expresses D220A MTAP (pTRE2:MTAP:D220A). (B) MTAP enzymatic activity measured in the same extracts as used in (A). Error bars show SD of enzyme assay (n = 4). All means are different from each other as assessed by one-way ANOVA followed by Tukey test (P < 0.01 for all comparisons).
Figure 2
Figure 2
Functional effects of MTAP expression in HT1080 cells. (A) Growth of indicated cell lines in soft agar. Ten thousand cells were plated in each well and image was taken after 14 d. Labeling is identical to Figure 1. (B) Invasion of cells through matrigel. Indicated cells are expressed as a percentage of the M− line. All assays performed in nine separate wells (n = 9). SD is indicated by bars. Different letters above each bar indicates that the means of all columns are different from each other as assessed by one-way ANOVA followed by Tukey test (P < 0.01 for all comparisons). (C) MTAP expression and wound healing. Confluent monolayers of the indicated cells were scratched and wound healing was monitored at 0, 8, and 24 hr as described in the Materials and Methods. Results are expressed as percent of wound openness. Error bars show SEM (n = 6). (D) Cell extracts (50 μg) from the indicated strains were loaded onto 10% gelatin-containing polyacrylamide gels and stained as described in the Materials and Methods. White bands indicate where MMPs have digested gelatin.
Figure 3
Figure 3
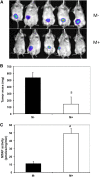
Growth of M− and M+ cells in SCID mice. (A) Green-florescent labeled HT1080 cells (6 × 10⁶) of the indicated genotype were injected into the flank of SCID mice (n = 5/group) and imaged after 6 wk using an in vivo imaging system imager. (B) Weight of tumors at 6 wk. Error bars show SD. Letter “a” indicates significant difference (P < 0.02) between cell types (C) MTAP enzymatic activity of tumors. Letter “a” indicates significant difference (P < 0.003) between cell types.
Figure 4
Figure 4
Quantitative real-time polymerase chain reaction (RT-PCR) of selected genes. The indicated genes were quantified by RT-PCR in M−, M+, or M+ cells exposed to MT-DAD-Me-ImmA (M+I) for 48 hr (see the section Materials and Methods). Data show relative transcript level compared with M− cells. All reactions were done in triplicate, and the SE is indicated. Letter “a” indicates a significant difference (P < 0.05) between each column and M− cells, whereas “b” indicates significant difference between M+ and M+I cells.
Figure 5
Figure 5
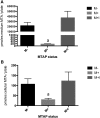
MTA levels in M−, M+, and M+I cells. (A) MTA levels as measured in cell medium from the indicated cell lines. Mean and SD are shown for each of the indicated cell lines (n = 3). “a” indicates P < 0.005 compared with M− cells. (B) Same as above, but MTA is measured in cells.
Figure 6
Figure 6
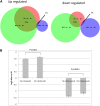
Comparison of transcriptional profiles between M−, M+, and M+I cells. (A) Venn diagram showing overlap in differentially regulated genes from the indicated comparisons. Size of circle is proportional to the number of differentially regulated genes in each comparison. The percentage of overlap between the different comparisons involving the M+ vs. M− set is shown. (B) Comparison of mean induction or repression of differentially expressed genes in M+, and M+I cells vs. M− controls. The error bars show the SEM. P-values are also shown (paired t-test, two-sided).

References

    1. Basu I., Cordovano G., Das I., Belbin T. J., Guha C., et al. , 2007. A transition state analogue of 5′-methylthioadenosine phosphorylase induces apoptosis in head and neck cancers. J. Biol. Chem. 282: 21477–21486. - PubMed
    1. Behrmann I., Wallner S., Komyod W., Heinrich P. C., Schuierer M., et al. , 2003. Characterization of methylthioadenosin phosphorylase (MTAP) expression in malignant melanoma. Am. J. Pathol. 163: 683–690. - PMC - PubMed
    1. Benjamini Y., Hochberg Y., 1995. Controlling the false discovery rate: a practical and powerful approach to multiple testing. J. R. Stat. Soc., B 57: 289–300.
    1. Brat D. J., James C. D., Jedlicka A. E., Connolly D. C., Chang E., et al. , 1999. Molecular genetic alterations in radiation-induced astrocytomas. Am. J. Pathol. 154: 1431–1438. - PMC - PubMed
    1. Camacho-Vanegas O., Camacho S. C., Till J., Miranda-Lorenzo I., Terzo E., et al. , 2012. Primate genome gain and loss: a bone dysplasia, muscular dystrophy, and bone cancer syndrome resulting from mutated retroviral-derived MTAP transcripts. Am. J. Hum. Genet. 90: 614–627. - PMC - PubMed

Publication types

Substances

LinkOut - more resources