. 2015 Jan 15;75(2):436-45.
doi: 10.1158/0008-5472.CAN-14-1041. Epub 2014 Nov 11.

Loss of estrogen-regulated microRNA expression increases HER2 signaling and is prognostic of poor outcome in luminal breast cancer

Affiliations

Loss of estrogen-regulated microRNA expression increases HER2 signaling and is prognostic of poor outcome in luminal breast cancer

Shannon T Bailey et al. Cancer Res. .

Abstract

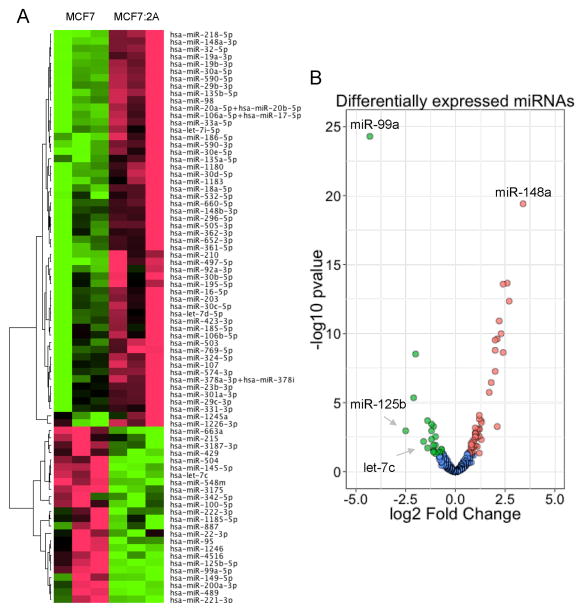
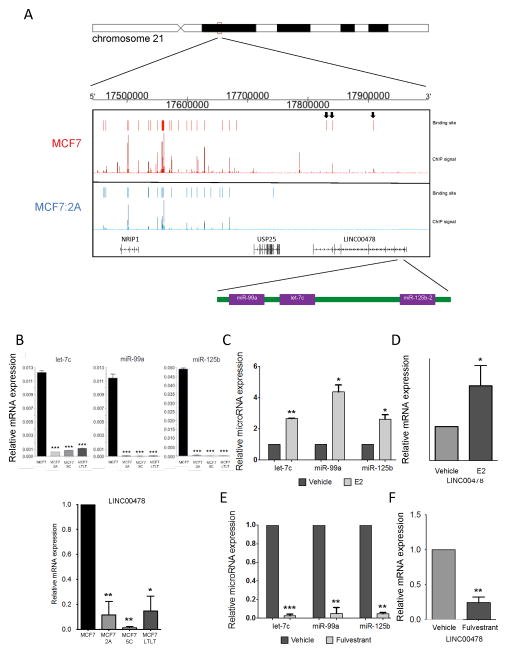
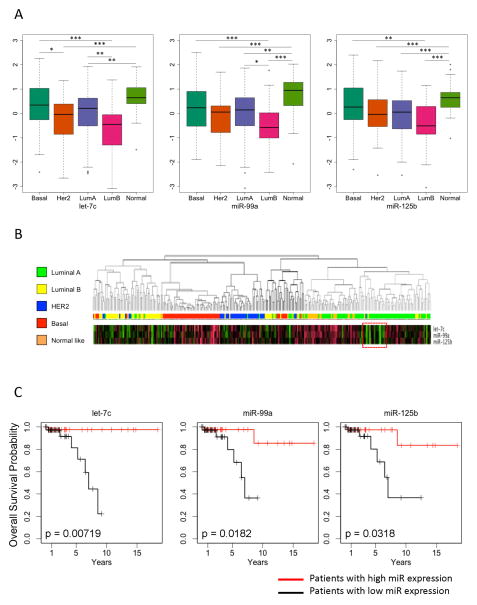
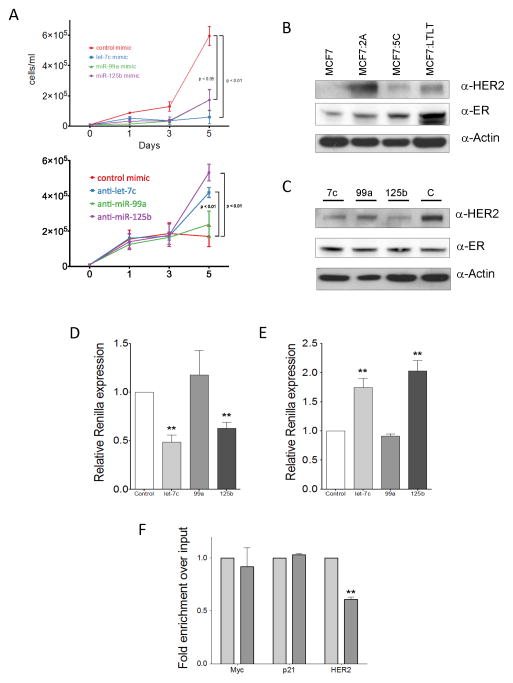
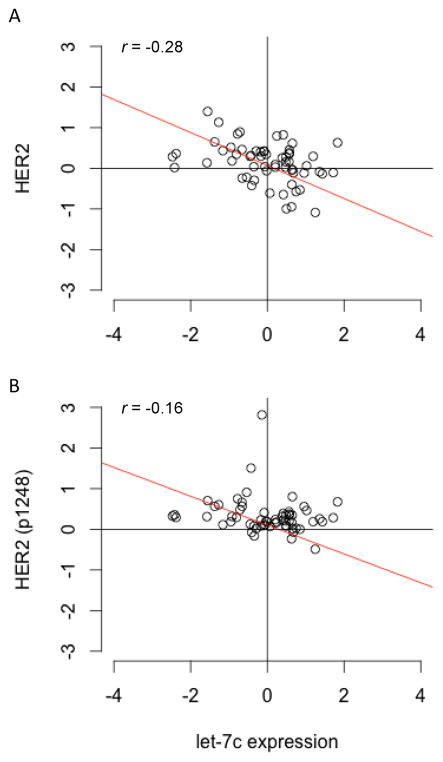
Among the genes regulated by estrogen receptor (ER) are miRNAs that play a role in breast cancer signaling pathways. To determine whether miRNAs are involved in ER-positive breast cancer progression to hormone independence, we profiled the expression of 800 miRNAs in the estrogen-dependent human breast cancer cell line MCF7 and its estrogen-independent derivative MCF7:2A (MCF7:2A) using NanoString. We found 78 miRNAs differentially expressed between the two cell lines, including a cluster comprising let-7c, miR99a, and miR125b, which is encoded in an intron of the long noncoding RNA LINC00478. These miRNAs are ER targets in MCF7 cells, and nearby ER binding and their expression are significantly decreased in MCF7:2A cells. The expression of these miRNAs was interrogated in patient samples profiled in The Cancer Genome Atlas (TCGA). Among luminal tumors, these miRNAs are expressed at higher levels in luminal A versus B tumors. Although their expression is uniformly low in luminal B tumors, they are lost only in a subset of luminal A patients. Interestingly, this subset with low expression of these miRNAs had worse overall survival compared with luminal A patients with high expression. We confirmed that miR125b directly targets HER2 and that let-7c also regulates HER2 protein expression. In addition, HER2 protein expression and activity are negatively correlated with let-7c expression in TCGA. In summary, we identified an ER-regulated miRNA cluster that regulates HER2, is lost with progression to estrogen independence, and may serve as a biomarker of poor outcome in ER(+) luminal A breast cancer patients.


Conflict of interest statement

Potential conflicts of interest: The authors declare no potential conflicts of interest.

Figures

Figure 1
Figure 1. Differentially expressed miRNAs in MCF7:2A vs. MCF7 cells
MCF7 and MCF7:2A cells were grown under standard culturing conditions, and small RNAs were extracted from each cell line. Each sample was then assayed for the expression of miRNA using nCounter NanoString assays. A) Heatmap demonstrating the differentially expressed miRNAs found in the MCF7:2A and MCF7 cells including 54 upregulated and 24 downregulated miRNAs. B) Volcano plot demonstrating the profile of the differentially expressed miRNAs in MCF7:2A vs. MCF7 cells. This plot demonstrates the fold change (x-axis) and significance level expressed as the −log10 p-value (y-axis). The green circles represent the miRNAs downregulated in the MCF7:2A compared with MCF7 cells, and the red circles represent the miRNAs upregulated in the MCF7:2A compared with MCF7 cells. The blue circles indicate miRNAs that were not significantly expressed. Significance was determined with a p-value cutoff of 0.05 and a 1.5 fold change.
Figure 2
Figure 2. The let-7c/miR-99a/miR-125b cluster is regulated by the ER
A) The top panel represents a schematic of the genomic location of the let-7c/miR-99a/miR-125b cluster within chromosome 21. The ER ChIP-Seq signal derived from both MCF7 (shown in red) and MCF7:2A (shown in blue) cells is shown demonstrating a loss of ER signal at the loci near the let-7c/miR-99a/miR-125b cluster. The ER binding sites within LINC00478 lost in MCF7:2A cells are indicated with arrows. B) The relative expression level of let-7c, miR-99a, and miR-125b (top) and LINC00478 (bottom) is shown in the MCF7, MCF7:2A, MCF7:5C, and MCF7:LTLT cell lines. C) and D) E2 regulates the expression of the cluster miRNAs and primary transcript. MCF7 cells were treated with E2 for 3 h, and the level of let-7c, miR-99a, miR-125b, and LINC00478 expression was determined by RT-PCR. E) and F) Fulvestrant treatment leads to loss of the cluster miRNAs and LINC00478. MCF7 cells were treated with fulvestrant for 48 h, and the level of let-7c, miR-99a, miR-125b, and LINC00478 expression was determined by RT-PCR. *, p < 0.01; **, p < 0.01, ***; p < 0.0001.
Figure 3
Figure 3. The expression of miR-99a, miR-125b, and let-7c is lowest in patients with luminal B breast cancer and predicts outcome in luminal A breast cancer
A) Patients with breast cancer from TCGA who were profiled for their mRNA and miRNA expression were analyzed for the expression of let-7c, miR-99a, miR-125b in the different PAM50 clinical subsets. All three miRNAs are expressed at the lowest levels in patients with luminal B breast cancer. *, p < 0.01; **, p < 0.001; p < 0.0001. B) The TCGA patients from A were clustered via hierarchical clustering, and the expression of let-7c, miR-99a, miR-125b is shown for each of the patient subsets. The dotted red box demonstrates the subset of luminal A patients with lower expression of the let-7c/miR-99a/miR-125b cluster C) Kaplan-Meier plot demonstrating the overall survival probability for patients with luminal A breast cancer based on the expression of let-7c, miR-99a, and miR-125b.
Figure 4
Figure 4. The let-7c/miR-99a/miR-125b cluster regulates the growth of breast cancer cells and downregulates HER2
A) MCF7:2A cells were transfected with the indicated miRNA mimics (top) or anti-miRs (bottom, split into a 96-well plate and allowed to grow for five days. Cells were counted on days one, three, and five to determine the growth rate. B) HER2 is expressed at a higher level in estrogen-independent cell lines. Western blot demonstrating HER2 expression in the MCF7, MCF7:2A, MCF7:5C, and MCF7:LTLT cell lines. The expression level of ER is also shown together with that of β-actin, which served as a loading control. C) HER2 is downregulated by let-7c and miR-125b overexpression. MCF7:2A cells were transfected with miRNA mimics for let-7c, miR-99a, and miR-125b. Cells were harvested after five days, and the level of HER2 expression was measured. The middle panel shows the expression of ER, which was unchanged with miRNA treatment. D) let-7c and miR-125b target HER2. A vector encoding the 3′-UTR of HER2 was transfected in HEK293 in the presence of miRNA mimics (D) and anti-miRs (E). The level of renilla luciferase expression was measured after 48 days and normalized to that of firefly luciferase. F) HER2 mRNA association with the Ago1 complex is lost in MCF7:2A cells. The Ago1 complex was immunoprecipiated from MCF7 and MCF7:2A cells, and the associated level of HER2 in each cell line as normalized to input total RNA was quantified by RT-PCR. The levels of associated Myc, p21, and HER2 mRNA are shown.
Figure 5
Figure 5. HER2 protein expression and activity is negatively correlated with let-7c expression
Luminal A breast cancer patient samples from TCGA for which protein expression data were generated were examined for their HER2 (A) and phosphorylated HER2 (B) expression levels. A negative correlation was found for both HER2 (A) and phosphorylated HER2 (B) protein expression, suggesting that HER2 expression and activity is negatively associated with let-7c miRNA expression in patients with breast cancer.

References

    1. Charpentier AH, Bednarek AK, Daniel RL, Hawkins KA, Laflin KJ, Gaddis S, et al. Effects of estrogen on global gene expression: identification of novel targets of estrogen action. Cancer research. 2000;60:5977–83. - PubMed
    1. Frasor J, Danes JM, Komm B, Chang KC, Lyttle CR, Katzenellenbogen BS. Profiling of estrogen up- and down-regulated gene expression in human breast cancer cells: insights into gene networks and pathways underlying estrogenic control of proliferation and cell phenotype. Endocrinology. 2003;144:4562–74. - PubMed
    1. Carroll JS, Meyer CA, Song J, Li W, Geistlinger TR, Eeckhoute J, et al. Genome-wide analysis of estrogen receptor binding sites. Nature genetics. 2006;38:1289–97. - PubMed
    1. Perou CM, Sorlie T, Eisen MB, van de Rijn M, Jeffrey SS, Rees CA, et al. Molecular portraits of human breast tumours. Nature. 2000;406:747–52. - PubMed
    1. Sorlie T, Tibshirani R, Parker J, Hastie T, Marron JS, Nobel A, et al. Repeated observation of breast tumor subtypes in independent gene expression data sets. Proceedings of the National Academy of Sciences of the United States of America. 2003;100:8418–23. - PMC - PubMed

Publication types