Target control of complex networks
- PMID: 25388503
- PMCID: PMC4243219
- DOI: 10.1038/ncomms6415
Target control of complex networks
Abstract
Controlling large natural and technological networks is an outstanding challenge. It is typically neither feasible nor necessary to control the entire network, prompting us to explore target control: the efficient control of a preselected subset of nodes. We show that the structural controllability approach used for full control overestimates the minimum number of driver nodes needed for target control. Here we develop an alternate 'k-walk' theory for directed tree networks, and we rigorously prove that one node can control a set of target nodes if the path length to each target node is unique. For more general cases, we develop a greedy algorithm to approximate the minimum set of driver nodes sufficient for target control. We find that degree heterogeneous networks are target controllable with higher efficiency than homogeneous networks and that the structure of many real-world networks are suitable for efficient target control.
Figures


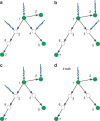
 for the target nodes {1, 2, 4, 6, 7}. The lower bound of PD is just given by the first iteration of the greedy algorithm, that is,
  for the target nodes {1, 2, 4, 6, 7}, because in the first iteration only node 1 is unmatched.


 (equation (4)) for SF networks in function of degree exponent γ for different values of average degree ‹k› in the random scheme. (b) The overall target control efficiency
  (equation (4)) in function of the average degree ‹k› for different values of the degree exponent γ for SF networks and ER networks for random scheme. (c,d) Local selection scheme. (c) The overall target control efficiency
  (equation (4)) for SF networks in function of degree exponent γ for different values of average degree ‹k› for local scheme. (d) The overall target control efficiency
  (equation (4)) in function of the average degree ‹k› for different values of degree exponent γ of SF networks and ER networks for local scheme. From a and b we can see that for large ‹k› when γ is small the system has positive target control efficiency, but when γ is greater than a certain value, the efficiency decreases monotonically with γ becoming negative. Comparing a,b with (c,d), we find that the local control can enhance the target control efficiency. The results are obtained by averaging over 200 realizations of networks with 104 nodes.
 (equation (4)) of the real-world networks for the random scheme. (c) Comparing the target control efficiency of real networks with their randomized counterparts for the random scheme after, we randomly rewire each network using degree-preserving randomization. (d–f) Local selection scheme. (d) The normalized fraction of driver nodes (αD) in function of the target node fraction f for the local scheme for different real-world networks. (e) The overall target control efficiency
  (equation (4)) of real-world networks for the local scheme. (f) Comparing the target control efficiency of real networks with their randomized counterparts for the local scheme after, we randomly rewire each network using degree-preserving randomization. The results are averaged over 500 realizations. In general, real networks and more efficient than their randomized counterparts with respect to random target control.
References
-
- Dorogovtsev S. N. & Mendes J. F. Evolution of Networks: From Biological Nets to the Internet and WWW (Physics) Oxford University Press (2003).
-
- Albert R. & Barabási A.-L. Statistical mechanics of complex networks. Rev. Mod. Phys. 74, 47–97 (2002).
-
- Cohen R. & Havlin S. Complex Networks: Structure, Robustness and Function Cambridge University Press: Cambridge, (2010).
-
- Newman M. E. J. Networks: An Introduction Oxford University Press (2010).
-
- Song C., Havlin S. & Makse H. A. Self-similarity of complex networks. Nature 433, 392–395 (2005). - PubMed
Publication types
LinkOut - more resources
Full Text Sources
Other Literature Sources

