. 2014 Nov 12;16(1):87.
doi: 10.1186/s12968-014-0087-8.

In vivo cardiovascular magnetic resonance diffusion tensor imaging shows evidence of abnormal myocardial laminar orientations and mobility in hypertrophic cardiomyopathy

Affiliations

In vivo cardiovascular magnetic resonance diffusion tensor imaging shows evidence of abnormal myocardial laminar orientations and mobility in hypertrophic cardiomyopathy

Pedro F Ferreira et al. J Cardiovasc Magn Reson. .

Abstract

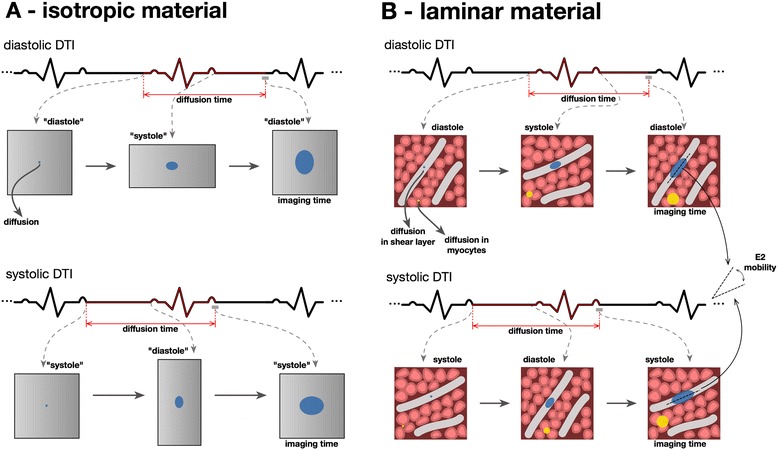
Background: Cardiac diffusion tensor imaging (cDTI) measures the magnitudes and directions of intramyocardial water diffusion. Assuming the cross-myocyte components to be constrained by the laminar microstructures of myocardium, we hypothesized that cDTI at two cardiac phases might identify any abnormalities of laminar orientation and mobility in hypertrophic cardiomyopathy (HCM).

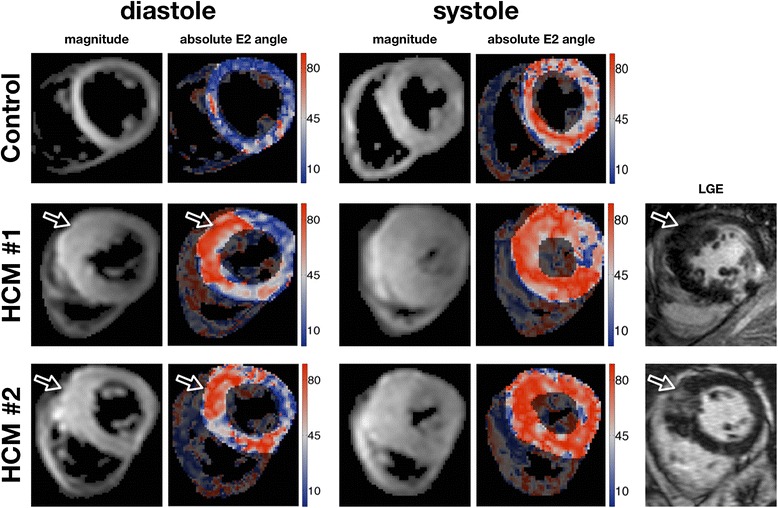
Methods: We performed cDTI in vivo at 3 Tesla at end-systole and late diastole in 11 healthy controls and 11 patients with HCM, as well as late gadolinium enhancement (LGE) for detection of regional fibrosis.

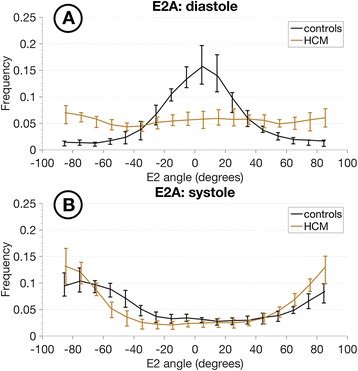
Results: Voxel-wise analysis of diffusion tensors relative to left ventricular coordinates showed expected transmural changes of myocardial helix-angle, with no significant differences between phases or between HCM and control groups. In controls, the angle of the second eigenvector of diffusion (E2A) relative to the local wall tangent plane was larger in systole than diastole, in accord with previously reported changes of laminar orientation. HCM hearts showed higher than normal global E2A in systole (63.9° vs 56.4° controls, p=0.026) and markedly raised E2A in diastole (46.8° vs 24.0° controls, p<0.001). In hypertrophic regions, E2A retained a high, systole-like angulation even in diastole, independent of LGE, while regions of normal wall thickness did not (LGE present 57.8°, p=0.0028, LGE absent 54.8°, p=0.0022 vs normal thickness 38.1°).

Conclusions: In healthy controls, the angles of cross-myocyte components of diffusion were consistent with previously reported transmural orientations of laminar microstructures and their changes with contraction. In HCM, especially in hypertrophic regions, they were consistent with hypercontraction in systole and failure of relaxation in diastole. Further investigation of this finding is required as previously postulated effects of strain might be a confounding factor.


Figures

Figure 1
Figure 1
Diagram of helix-angle and secondary eigenvector orientation. Diagram illustrating how helix angle (E1A) and E2A values were calculated for each voxel. A) Cubic portions of three non-contiguous voxels are illustrated from subendocardial, mid-wall and subepicardial layers. The local cardiac coordinate directions, longitudinal, circumferential and radial, are marked. B) Helix-angle is calculated between the circumferential direction and the projection of the primary eigenvector, presumably parallel to myocytes, in the tangential plane shown. Examples of positive and negative helix angles are shown below. C) The cubes are each sectioned perpendicular to E1proj to calculate cross-myocyte components of diffusion, presumably constrained by the sheetlet and shear layer microstructure, which is shaded brown. D) The E2 angle is measured between the secondary eigenvector projection and cross-myocyte direction in the wall tangent plane. Examples of positive and negative E2 angles are shown on the right.
Figure 2
Figure 2
3D visualization of helix-angle and secondary eigenvector orientation. Three dimensional visualization of the principal myocyte-parallel (helix angle) and cross-myocyte (E2) directions of diffusion. Panels A, B, E and F show principal eigenvector tractography for a control and an HCM patient in late diastole and end systole respectively. Scale bars show color coding for helix angle. The poor quality of the tracts in the diastolic control example is due to the reduced spatial resolution available. Panels C, D, G and H show the diffusion tensor represented by superquadric glyphs superimposed with cylinders representing the E2 direction of each tensor only. The superquadric glyphs are color coded according to the absolute E2 angle as in the scale bars: blue towards wall-parallel and red towards wall-perpendicular. The glyphs typically reorientate from blue to red in the control, but in the hypertrophic septal regions in HCM, are aligned in what would normally be a relatively systolic, more wall-perpendicular orientation, in both diastole as well as systole.
Figure 3
Figure 3
Magnitude, helix-angle, and secondary eigenvector orientation maps. Examples of an averaged magnitude image with the corresponding HA, E2A, and absolute E2A maps for a control and an HCM subject, at the two imaged cardiac phases. While positive and negative angles are colored differently in the E2A map to distinguish different dominant regional orientations in the individuals shown, maps of absolute E2A in the rightmost column allow clearer appreciation of angulations relative to the wall plane, changing from diastole to systole in the control, but remaining relatively steep or systole-like in both phases in HCM.
Figure 4
Figure 4
Helix-angle histograms. Histogram of myocardial HA values measured in all three slices per subject at the two cardiac phases for the two groups (bin size 10 degrees). The lines represent the median for each bin and the vertical bars the corresponding interquartile range. A) Diastole, B) Systole.
Figure 5
Figure 5
Secondary eigenvector orientation histograms. Histogram of myocardial E2A values measured in all three slices per subject at the two cardiac phases for the two groups (bin size 10 degrees). The lines represent the median for each bin and the vertical bars the corresponding interquartile range. A) Diastole, showing predominance of low angles, towards wall-parallel, in controls, and a relatively wide even distribution of angles from all wall regions in HCM. B) A predominance of high angles, towards wall-perpendicular for both groups, with more extreme angles towards wall-perpendicular for HCM.
Figure 6
Figure 6
Secondary eigenvector mobility. Scatter plots showing the E2 mobility (mean absolute E2 angle change between diastole and systole) for all subjects at the two imaged cardiac phases. A) Global mean E2A values. B) Global controls vs HCM cohort with the myocardium divided into three different regions: regions with hypertrophy and LGE (H+LG+), regions with hypertrophy but no LGE (H+LG-), and regions with no hypertrophy or LGE (H-LG-). In all plots the median and interquartile range are shown. The plots include a colour bar, which encodes the y-axis values. Of note, it shows the most abnormal orientations, inclined steeply inward from the wall plane with low mobility, in the hypertrophic regions, whether not there is LGE evidence of fibrosis. *P-value multiplied by 2for Bonferroni correction for 2 tests. †P-value multiplied by 3 for Bonferroni correction for 3 tests.
Figure 7
Figure 7
Magnitude, secondary eigenvector orientation and LGE in HCM. Averaged magnitude image and the respective absolute E2A angle maps for a control and 2 HCM examples with anteroseptal hypertrophy at the 2 imaged cardiac phases. Additionally the 2 HCM examples also have on the right the matching LGE images. E2A differences between controls and HCM can be seen in the hypertrophied regions, mainly in the diastolic phase. The non-hypertrophic lateral wall in both HCM hearts approaches the absolute E2A angles measured in the control heart.
Figure 8
Figure 8
Porcine heart histology. The heart of a 60 kg pig that had been killed for food production, was excised, fixed by immersion in formalin and sectioned in a short axis plane (panel A). A full thickness wedge, outlined in black, was cut from its lateral LV wall at mid ventricular level. From it, a slice about 2 mm thick was made by two cuts parallel to the local epicardial surface as indicated by the orange rectangle. This slice (inset B) was then cut obliquely, as indicated by lines between the arrowheads, perpendicular to the local myocytes. The two pieces were set in wax and selected surfaces sectioned by microtome and trichrome stained for histology. A high power image of part of a wall tangent face, indicated by the small red region in B, is shown in panel C. The long axes of myocytes lie nearly parallel to this slice and a number of pale Z bands between sarcomeres are visible. A low power image of a cross-myocyte plane is shown in panel D, giving an overview of laminar structures, which slope obliquely to its upper and lower wall tangent edges, generally in two different oblique populations. The upper edge is the more endocardial, corresponding to the line arrowed obliquely in B. The area indicated by the black rectangle is magnified in panel E, where the transected myocytes can be seen to be aggregated in sheetlets, 4–8 myocytes thick, separated by white fissures or shear layers. The scale bars allow the structures and textures seen in each panel to be considered in relation to the typical root mean square distance of aqueous diffusion of about 40-60 μm in a cardiac cycle, and to the dimensions of the cDTI voxels of 2.7 × 2.7 × 8 mm acquired in our study.
Figure 9
Figure 9
Diffusion on isotropic and laminar materials. A: Schematic illustration of the effects of a cycle of strain on aqueous diffusion through a structurally isotropic material such as a homogeneous gel. The expected progression of limits of diffusion from a single point is illustrated (blue ellipse). On the left panels the DTI sequence is initiated; the mid panels show the progress of diffusion at the opposite phase of the cycle; and the right hand panels show the extent of diffusion at the time of DTI readout. B: Schematic illustration of supposed aqueous diffusion through a laminar material. The changes between diastole and systole entail the shearing and slight swivelling of the sheetlets and shear layers. In general these maintain their proportions, but not their orientations. The anistropies of diffusion of water molecules through different parts of such a complex dynamic fabric remain unknown and hard to predict. However, it seems likely that cross-myocyte diffusion would extend most freely along shear layers (blue) and least freely through the myocytes (yellow) aggregated in a single sheetlet, as indicated very approximately by the two examples of diffusion boundaries. Importantly, cDTI is only, at best, capable of measuring averaged values of all diffusions in a voxel, including those along different populations of shear layers.

Comment in

References

    1. Pettigrew JB. On the arrangement of the muscular fibres in the ventricles of the vertebrate, with physiological remarks. Philos Trans. 1864;154:445–500. doi: 10.1098/rstl.1864.0014. - DOI
    1. Smerup M, Nielsen E, Agger P, Frandsen J, Vestergaard-Poulsen P, Andersen J, Nyengaard J, Pedersen M, Ringgaard S, Hjortdal V, Lunkenheimer PP, Anderson RH. The three-dimensional arrangement of the myocytes aggregated together within the mammalian ventricular myocardium. Anat Rec. 2009;292:1–11. doi: 10.1002/ar.20798. - DOI - PubMed
    1. Sands GB, Gerneke DA, Hooks DA, Green CR, Smaill BH, LeGrice IJ. Automated imaging of extended tissue volumes using confocal microscopy. Microsc Res Tech. 2005;67:227–39. doi: 10.1002/jemt.20200. - DOI - PubMed
    1. Hales PW, Schneider JE, Burton RA, Wright BJ, Bollensdorff C, Kohl P. Histo-anatomical structure of the living isolated rat heart in two contraction states assessed by diffusion tensor MRI. Prog Biophys Mol Biol. 2012;110:319–30. doi: 10.1016/j.pbiomolbio.2012.07.014. - DOI - PMC - PubMed
    1. Harrington KB, Rodriguez F, Cheng A, Langer F, Ashikaga H, Daughters GT, Criscione JC, Ingels NB, Miller DC. Direct measurement of transmural laminar architecture in the anterolateral wall of the ovine left ventricle: new implications for wall thickening mechanics. Am J Physiol Heart Circ Physiol. 2005;288:H1324–30. doi: 10.1152/ajpheart.00813.2004. - DOI - PMC - PubMed

Publication types