

Understanding high and low patient experience scores in primary care: analysis of patients' survey data for general practices and individual doctors
- PMID: 25389136
- PMCID: PMC4230029
- DOI: 10.1136/bmj.g6034
Understanding high and low patient experience scores in primary care: analysis of patients' survey data for general practices and individual doctors
Erratum in
- BMJ. 2014;349:g6898
Abstract
Objectives: To determine the extent to which practice level scores mask variation in individual performance between doctors within a practice.
Design: Analysis of postal survey of patients' experience of face-to-face consultations with individual general practitioners in a stratified quota sample of primary care practices.
Setting: Twenty five English general practices, selected to include a range of practice scores on doctor-patient communication items in the English national GP Patient Survey.
Participants: 7721 of 15,172 patients (response rate 50.9%) who consulted with 105 general practitioners in 25 practices between October 2011 and June 2013.
Main outcome measure: Score on doctor-patient communication items from post-consultation surveys of patients for each participating general practitioner. The amount of variance in each of six outcomes that was attributable to the practices, to the doctors, and to the patients and other residual sources of variation was calculated using hierarchical linear models.
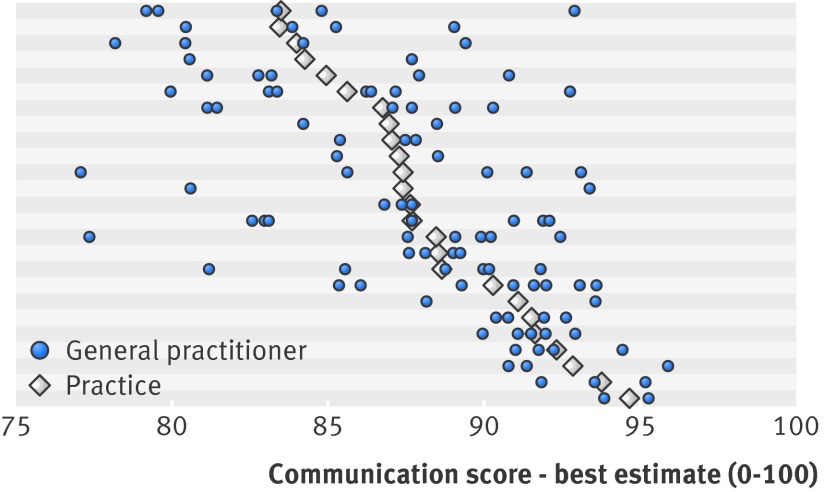
Results: After control for differences in patients' age, sex, ethnicity, and health status, the proportion of variance in communication scores that was due to differences between doctors (6.4%) was considerably more than that due to practices (1.8%). The findings also suggest that higher performing practices usually contain only higher performing doctors. However, lower performing practices may contain doctors with a wide range of communication scores.
Conclusions: Aggregating patients' ratings of doctors' communication skills at practice level can mask considerable variation in the performance of individual doctors, particularly in lower performing practices. Practice level surveys may be better used to "screen" for concerns about performance that require an individual level survey. Higher scoring practices are unlikely to include lower scoring doctors. However, lower scoring practices require further investigation at the level of the individual doctor to distinguish higher and lower scoring general practitioners.
© Roberts et al 2014.
Conflict of interest statement
Competing interests: All authors have completed the ICMJE uniform disclosure form at
Figures

Comment in
-
Quality in primary care.BMJ. 2014 Nov 11;349:g6485. doi: 10.1136/bmj.g6485. BMJ. 2014. PMID: 25389154 No abstract available.
References
-
- Contandriopoulos D, Champagne F, Denis J-L. The multiple causal pathways between performance measures’ use and effects. Med Care Res Rev 2014;71:3-20. - PubMed
-
- Fung CH, Lim Y-W, Mattke S, Damberg C, Shekelle PG. Systematic review: the evidence that publishing patient care performance data improves quality of care. Ann Intern Med 2008;148:111-23. - PubMed
-
- Health Research Institute. Scoring healthcare: navigating customer experience ratings. PricewaterhouseCoopers, 2013.
-
- NHS England. Improving general practice: a call to action. 2013. www.england.nhs.uk/ourwork/com-dev/igp-cta/.
-
- Iacobucci G. General practices could be subject to “Ofsted style” ratings within two years. BMJ 2013;346:f1941. - PubMed
Publication types
MeSH terms
Grants and funding
LinkOut - more resources
Full Text Sources
Other Literature Sources