. 2014 Oct 24:6:445-54.
doi: 10.1016/j.nicl.2014.10.009. eCollection 2014.

Validation of an optimized SPM procedure for FDG-PET in dementia diagnosis in a clinical setting

Affiliations

Validation of an optimized SPM procedure for FDG-PET in dementia diagnosis in a clinical setting

Daniela Perani et al. Neuroimage Clin. .

Abstract

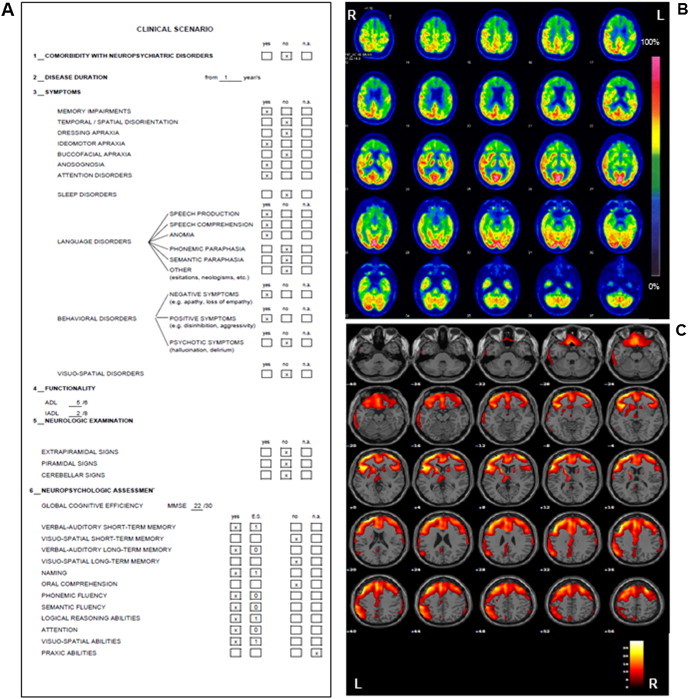
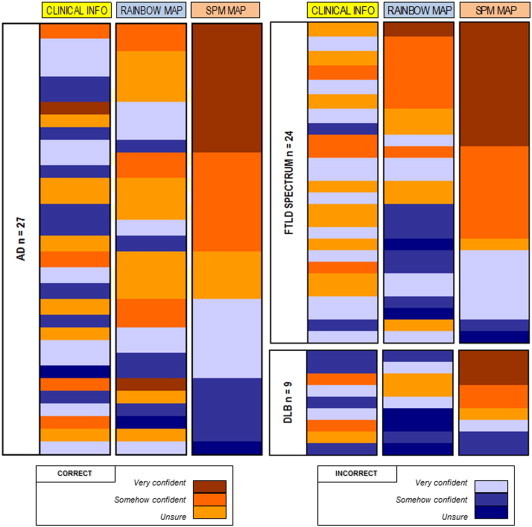
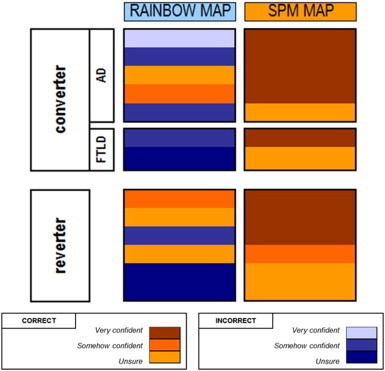
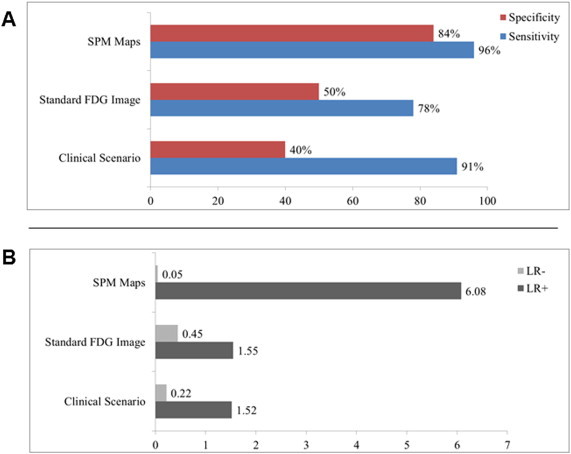
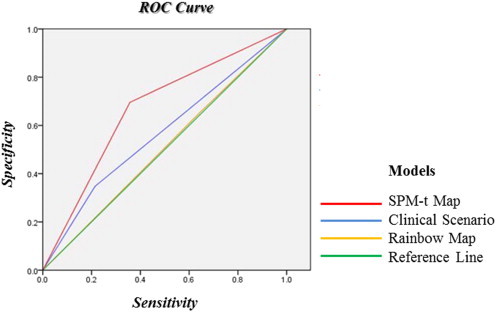
Diagnostic accuracy in FDG-PET imaging highly depends on the operating procedures. In this clinical study on dementia, we compared the diagnostic accuracy at a single-subject level of a) Clinical Scenarios, b) Standard FDG Images and c) Statistical Parametrical (SPM) Maps generated via a new optimized SPM procedure. We evaluated the added value of FDG-PET, either Standard FDG Images or SPM Maps, to Clinical Scenarios. In 88 patients with neurodegenerative diseases (Alzheimer's Disease-AD, Frontotemporal Lobar Degeneration-FTLD, Dementia with Lewy bodies-DLB and Mild Cognitive Impairment-MCI), 9 neuroimaging experts made a forced diagnostic decision on the basis of the evaluation of the three types of information. There was also the possibility of a decision of normality on the FDG-PET images. The clinical diagnosis confirmed at a long-term follow-up was used as the gold standard. SPM Maps showed higher sensitivity and specificity (96% and 84%), and better diagnostic positive (6.8) and negative (0.05) likelihood ratios compared to Clinical Scenarios and Standard FDG Images. SPM Maps increased diagnostic accuracy for differential diagnosis (AD vs. FTD; beta 1.414, p = 0.019). The AUC of the ROC curve was 0.67 for SPM Maps, 0.57 for Clinical Scenarios and 0.50 for Standard FDG Images. In the MCI group, SPM Maps showed the highest predictive prognostic value (mean LOC = 2.46), by identifying either normal brain metabolism (exclusionary role) or hypometabolic patterns typical of different neurodegenerative conditions.

Keywords: Dementia diagnosis; FDG-PET imaging; Statistical Parametrical Mapping; Voxel-based analysis.


Figures

Fig. 1
Fig. 1
Example of the material provided for each subject: A) a Clinical Scenario; B) a Standard FDG Image and C) an SPM Map of a patient affected by behavioural variant of frontotemporal dementia. L = Left; R = right.
Fig. 2
Fig. 2
Mean raters' performance for diagnostic accuracy and confidence level in dementia patients. Each horizontal bar represents the ratings in a single subject for each of the three information (Clinical Scenarios, Standard FDG Images and SPM Maps). Clinical diagnoses judged to be correct are shown in shades of red (red = very confident, orange = somehow confident, pale orange = unsure). Incorrect diagnoses are shown in shades of blue (dark blue = very confident, azure = somehow confident, sky blue = unsure).
Fig. 3
Fig. 3
Mean raters' performance for diagnostic accuracy and confidence level in MCI subjects who converted to dementia or reverted to normal condition. Each horizontal bar represents the ratings in a single subject for Standard FDG Image (left column) and SPM Map (right column) information. Clinical diagnoses judged to be correct are shown in shades of red (red = very confident, orange = somehow confident, pale orange = unsure). Incorrect diagnoses are shown in shades of blue (dark blue = very confident, azure = somehow confident, sky blue = unsure).
Fig. 4
Fig. 4
A) Sensitivity (blue) and specificity (red) values of Clinical Scenarios, Standard FDG Image and SPM Maps. B) Positive (LR+) (dark grey) and negative (LR−) likelihood (pale grey) ratio for correct classification of patients, broken down by type of information.
Fig. 5
Fig. 5
ROC curve for Clinical Scenarios (area under the ROC curve (AUC) = 0.57), Standard FDG Images (AUC = 0.50) and SPM Maps (AUC = 0.67) models, showing the better correct classification through SPM Maps.

References

    1. Albert M.S., DeKosky S.T., Dickson D. The diagnosis of mild cognitive impairment due to Alzheimer's disease: recommendations from the National Institute on Aging–Alzheimer's Association workgroups on diagnostic guidelines for Alzheimer's disease. Alzheimer's & Dementia: the Journal of the Alzheimer's Association. 2011;7(3):270–279. 21514249 - PMC - PubMed
    1. Anchisi D., Borroni B., Franceschi M. Heterogeneity of brain glucose metabolism in mild cognitive impairment and clinical progression to Alzheimer disease. Archives of Neurology. 2005;62(11):1728–1733. 16286547 - PubMed
    1. Armstrong M.J., Litvan I., Lang A.E. Criteria for the diagnosis of corticobasal degeneration. Neurology. 2013;80(5):496–503. 23359374 - PMC - PubMed
    1. Bateman R.J., Xiong C., Benzinger T.L. Clinical and biomarker changes in dominantly inherited Alzheimer's disease. New England Journal of Medicine. 2012;367(9):795–804. 22784036 - PMC - PubMed
    1. Bohnen N.I., Djang D.S., Herholz K., Anzai Y., Minoshima S. Effectiveness and safety of 18F-FDG PET in the evaluation of dementia: a review of the recent literature. Journal of Nuclear Medicine: Official Publication, Society of Nuclear Medicine. 2012;53(1):59–71. 22173840 - PubMed

Publication types

Substances