. 2014 Nov 12;9(11):e112118.
doi: 10.1371/journal.pone.0112118. eCollection 2014.

Tissue-specific expression of monocarboxylate transporters during fasting in mice

Affiliations

Tissue-specific expression of monocarboxylate transporters during fasting in mice

Alexandra Schutkowski et al. PLoS One. .

Abstract

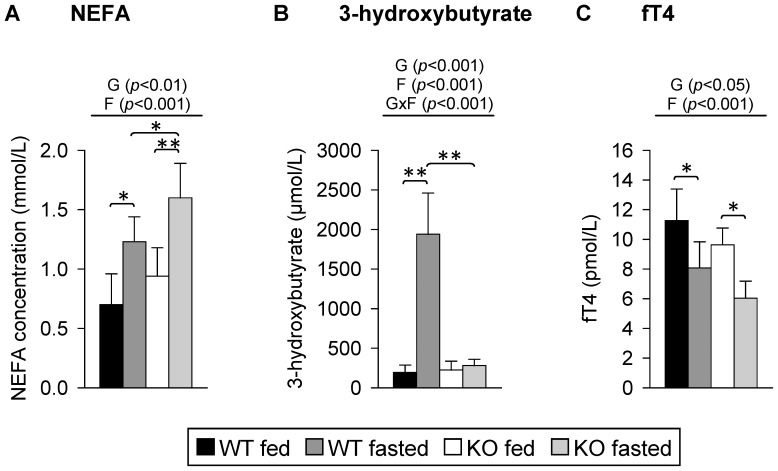
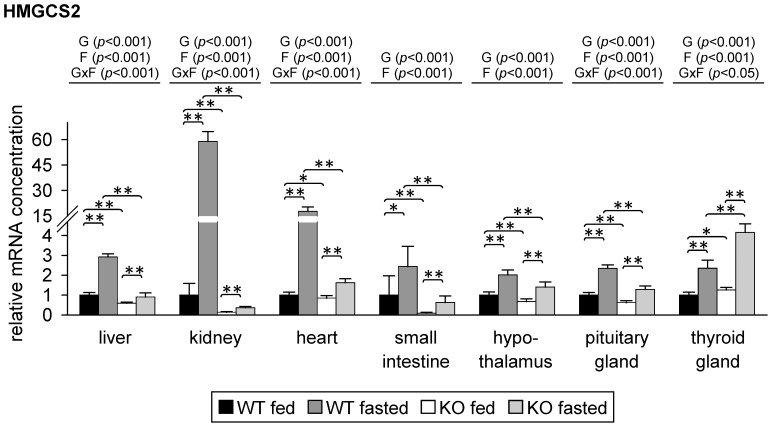
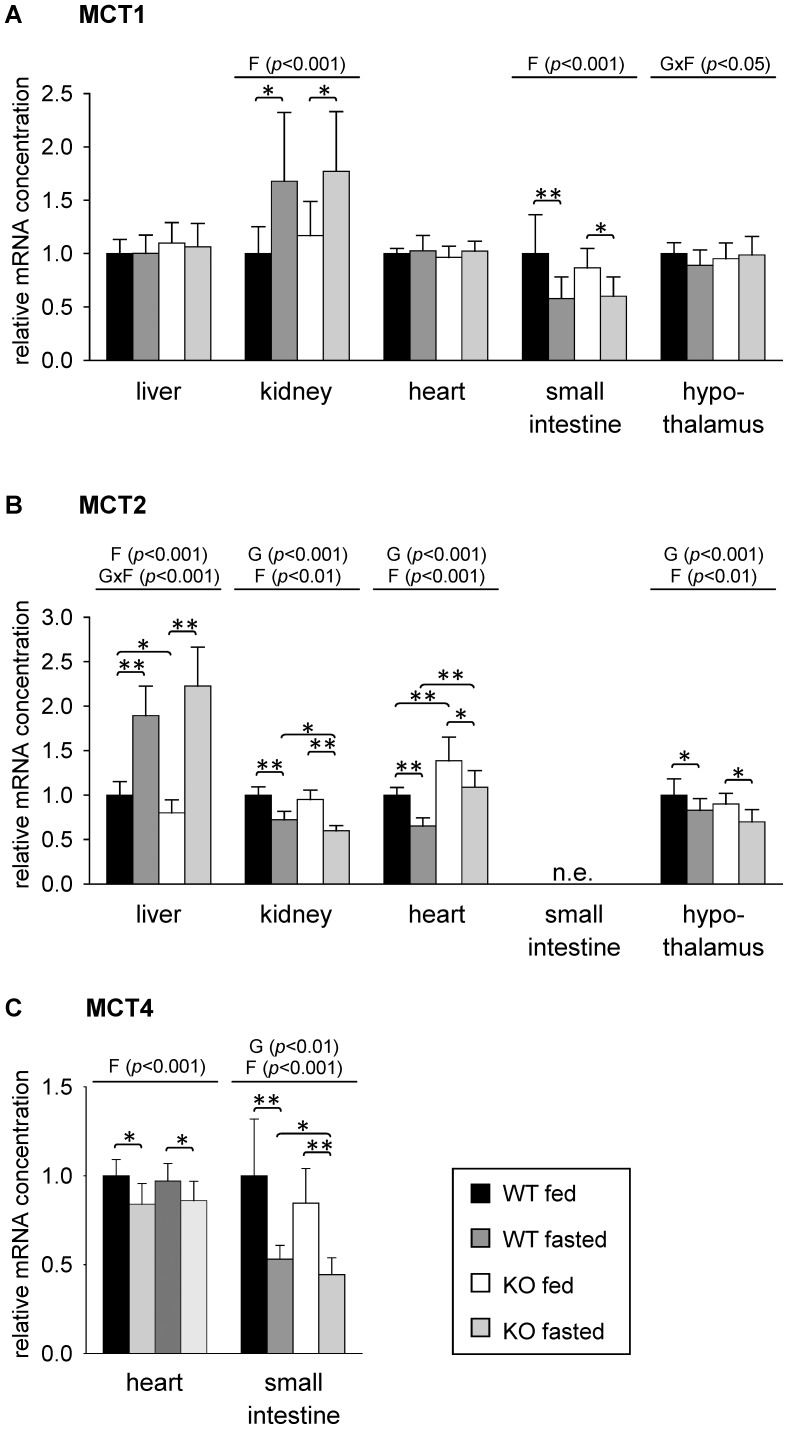
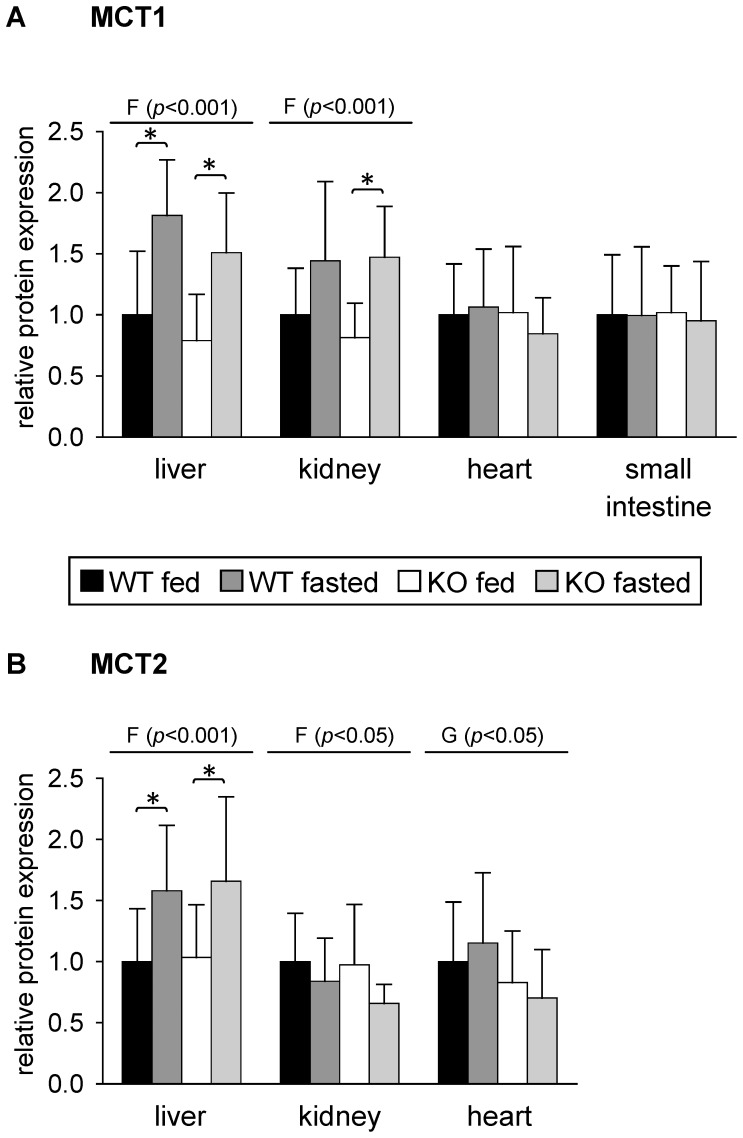
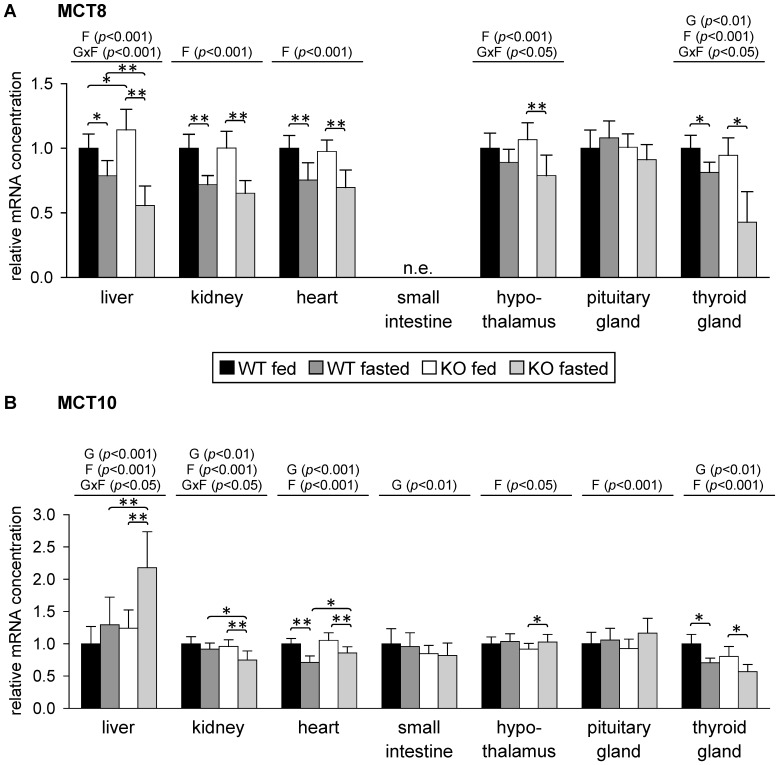
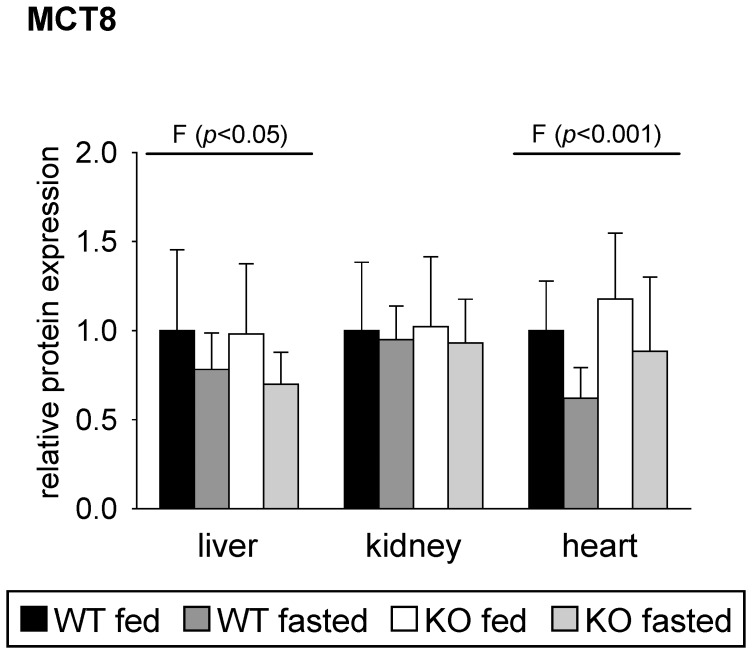
Monocarboxylates such as pyruvate, lactate and ketone bodies are crucial for energy supply of all tissues, especially during energy restriction. The transport of monocarboxylates across the plasma membrane of cells is mediated by monocarboxylate transporters (MCTs). Out of 14 known mammalian MCTs, six isoforms have been functionally characterized to transport monocarboxylates and short chain fatty acids (MCT1-4), thyroid hormones (MCT8, -10) and aromatic amino acids (MCT10). Knowledge on the regulation of the different MCT isoforms is rare. In an attempt to get more insights in regulation of MCT expression upon energy deprivation, we carried out a comprehensive analysis of tissue specific expression of five MCT isoforms upon 48 h of fasting in mice. Due to the crucial role of peroxisome proliferator-activated receptor (PPAR)-α as a central regulator of energy metabolism and as known regulator of MCT1 expression, we included both wildtype (WT) and PPARα knockout (KO) mice in our study. Liver, kidney, heart, small intestine, hypothalamus, pituitary gland and thyroid gland of the mice were analyzed. Here we show that the expression of all examined MCT isoforms was markedly altered by fasting compared to feeding. Expression of MCT1, MCT2 and MCT10 was either increased or decreased by fasting dependent on the analyzed tissue. MCT4 and MCT8 were down-regulated by fasting in all examined tissues. However, PPARα appeared to have a minor impact on MCT isoform regulation. Due to the fundamental role of MCTs in transport of energy providing metabolites and hormones involved in the regulation of energy homeostasis, we assumed that the observed fasting-induced adaptations of MCT expression seem to ensure an adequate energy supply of tissues during the fasting state. Since, MCT isoforms 1-4 are also necessary for the cellular uptake of drugs, the fasting-induced modifications of MCT expression have to be considered in future clinical care algorithms.


Conflict of interest statement

Competing Interests: The authors have declared that no competing interests exist.

Figures

Figure 1
Figure 1. Final plasma concentrations of (A) non-esterified fatty acids (NEFA), (B) 3-hydroxybutyrate and (C) free thyroxine (fT4) in response to fasting and PPARα.
Values represent means ± SD of plasma concentrations of wildtype (WT) and PPARα knockout (KO) mice that were fed ad libitum or fasted for 48 h (n = 16 for 3-hydroxybutyrate, n = 8 for NEFA and fT4). Data were analyzed by two-way ANOVA. Classification factors were genotype, fasting, and the interaction between both factors. P-values revealed by two-way ANOVA are noted above the figures. Individual means of the treatment groups were compared by Tukey's test in case of variance homogeneity. In case of variance heterogeneity, as revealed by Levene's test, individual means were compared by Games Howell test. Horizontal brackets represent differences between groups in post-hoc comparison (**p<0.001, *p<0.05).
Figure 2
Figure 2. Relative mRNA concentrations of 3-hydroxy-3-methylglutaryl-coenzyme A synthase (HMGCS)-2 in mouse tissues in response to fasting and PPARα.
Values represent means ± SD of relative mRNA concentrations of wildtype (WT) and PPARα knockout (KO) mice that were fed ad libitum or fasted for 48 h (n = 16 for liver, kidney, heart, small intestine and hypothalamus; n = 8 for pituitary gland, n = 6 for thyroid gland). Data were analyzed by two-way ANOVA. Classification factors were genotype, fasting, and the interaction between both factors. P-values revealed by two-way ANOVA are noted above the figures. Individual means of the treatment groups were compared by Tukey's test in case of variance homogeneity. In case of variance heterogeneity, as revealed by Levene's test, individual means were compared by Games Howell test. Horizontal brackets represent differences between groups in post-hoc comparison (**p<0.001, *p<0.05).
Figure 3
Figure 3. Relative mRNA concentrations of (A) monocarboxylate transporter (MCT)-1, (B) MCT2 and (C) MCT4 in mouse tissues in response to fasting and PPARα.
Values represent means ± SD of relative mRNA concentrations of wildtype (WT) and PPARα knockout (KO) mice that were fed ad libitum or fasted for 48 h (n = 16). Data were analyzed by two-way ANOVA. Classification factors were genotype, fasting, and the interaction between both factors. P-values revealed by two-way ANOVA are noted above the figures. Individual means of the treatment groups were compared by Tukey's test in case of variance homogeneity. In case of variance heterogeneity, as revealed by Levene's test, individual means were compared by Games Howell test. Horizontal brackets represent differences between groups in post-hoc comparison (**p<0.001, *p<0.05). n.e., not evaluable due to extremely low expression.
Figure 4
Figure 4. Relative protein expression of (A) monocarboxylate transporter (MCT)-1 and (B) MCT2 in mouse tissues in response to fasting and PPARα.
Values represent means ± SD of relative protein expression of wildtype (WT) and PPARα knockout (KO) mice that were fed ad libitum or fasted for 48 h (n = 16). Data were analyzed by two-way ANOVA. Classification factors were genotype, fasting, and the interaction between both factors. P-values revealed by two-way ANOVA are noted above the figures. Individual means of the treatment groups were compared by Tukey's test in case of variance homogeneity. In case of variance heterogeneity, as revealed by Levene's test, individual means were compared by Games Howell test. Horizontal brackets represent differences between groups in post-hoc comparison (*p<0.05).
Figure 5
Figure 5. Relative mRNA concentration of (A) monocarboxylate transporter (MCT)-8 and (B) MCT10 in mouse tissues in response to fasting and PPARα.
Values represent means ± SD of relative mRNA concentrations of wildtype (WT) and PPARα knockout (KO) mice that were fed ad libitum or fasted for 48 h (n = 16 for liver, kidney, heart, small intestine and hypothalamus, n = 8 for pituitary gland, n = 6 for thyroid gland). Data were analyzed by two-way ANOVA. Classification factors were genotype, fasting, and the interaction between both factors. P-values revealed by two-way ANOVA are noted above the figures. Individual means of the treatment groups were compared by Tukey's test in case of variance homogeneity. In case of variance heterogeneity, as revealed by Levene's test, individual means were compared by Games Howell test. Horizontal brackets represent differences between groups in post-hoc comparison (**p<0.001, *p<0.05). n.e., not evaluable due to extremely low expression.
Figure 6
Figure 6. Relative protein expression of monocarboxylate transporter (MCT)-8 in mouse tissues in response to fasting and PPARα.
Values represent means ± SD of relative protein expression of wildtype (WT) and PPARα knockout (KO) mice that were fed ad libitum or fasted for 48 h (n = 16). Data were analyzed by two-way ANOVA. Classification factors were genotype, fasting, and the interaction between both factors. P-values revealed by two-way ANOVA are noted above the figures. Individual means of the treatment groups were compared by Tukey's test in case of variance homogeneity. In case of variance heterogeneity, as revealed by Levene's test, individual means were compared by Games Howell test. No significant differences in post-hoc comparison were revealed.

References

    1. Halestrap AP (2012) The monocarboxylate transporter family—Structure and functional characterization. IUBMB Life 64: 1–9. - PubMed
    1. Halestrap AP, Wilson MC (2012) The monocarboxylate transporter family—role and regulation. IUBMB Life 64: 109–119. - PubMed
    1. Broer S, Schneider HP, Broer A, Rahman B, Hamprecht B, et al. (1998) Characterization of the monocarboxylate transporter 1 expressed in Xenopus laevis oocytes by changes in cytosolic pH. Biochem J 333: 167–174. - PMC - PubMed
    1. Broer S, Broer A, Schneider HP, Stegen C, Halestrap AP, et al. (1999) Characterization of the high-affinity monocarboxylate transporter MCT2 in Xenopus laevis oocytes. Biochem J 341: 529–535. - PMC - PubMed
    1. Dimmer KS, Friedrich B, Lang F, Deitmer JW, Broer S (2000) The low-affinity monocarboxylate transporter MCT4 is adapted to the export of lactate in highly glycolytic cells. Biochem J 350: 219–227. - PMC - PubMed

MeSH terms