. 2014 Nov 13;515(7526):264-8.
doi: 10.1038/nature13973.

Radial glia require PDGFD-PDGFRβ signalling in human but not mouse neocortex

Affiliations

Radial glia require PDGFD-PDGFRβ signalling in human but not mouse neocortex

Jan H Lui et al. Nature. .

Abstract

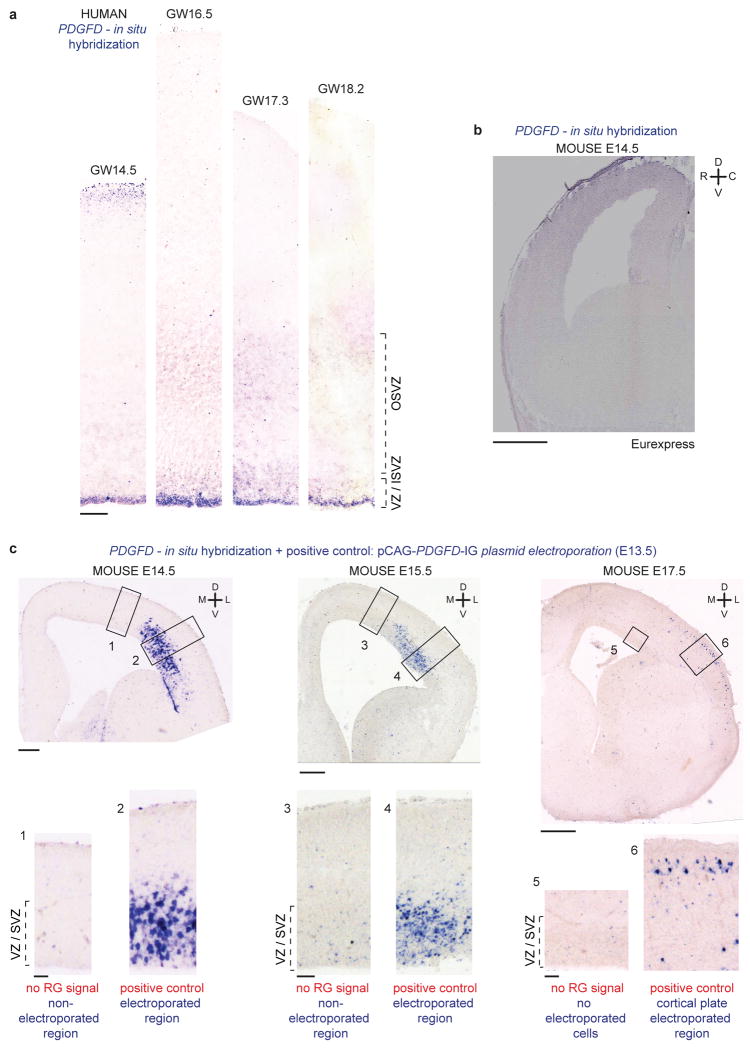
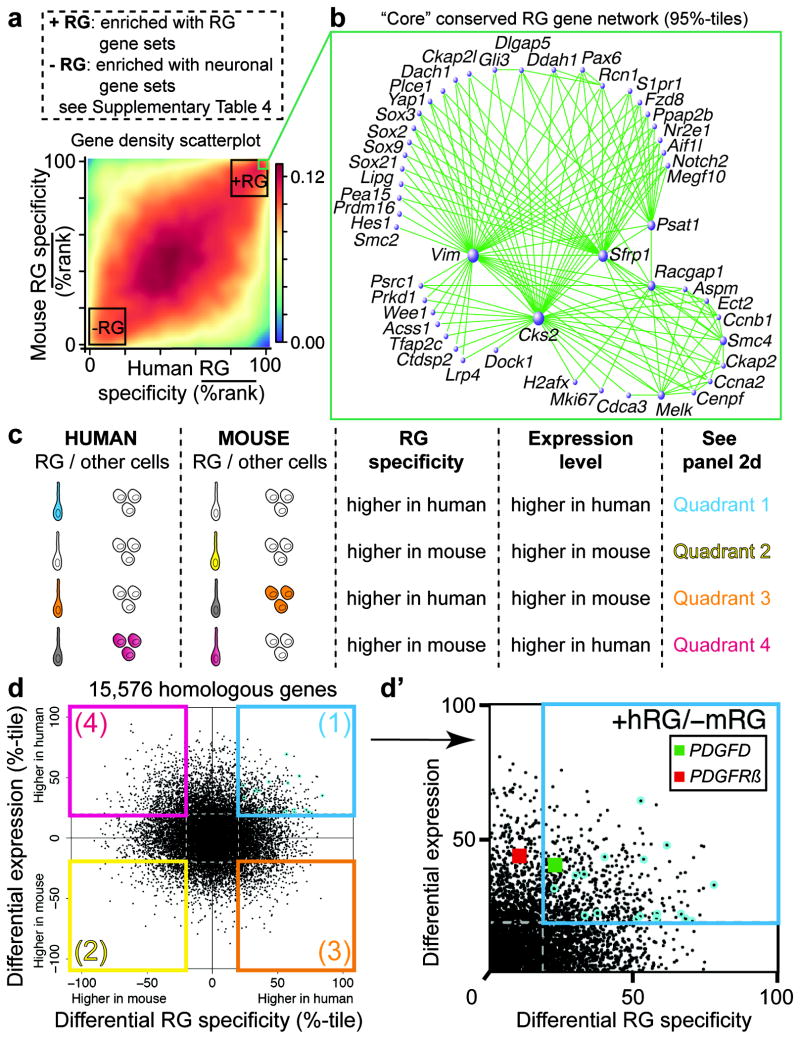
Evolutionary expansion of the human neocortex underlies many of our unique mental abilities. This expansion has been attributed to the increased proliferative potential of radial glia (RG; neural stem cells) and their subventricular dispersion from the periventricular niche during neocortical development. Such adaptations may have evolved through gene expression changes in RG. However, whether or how RG gene expression varies between humans and other species is unknown. Here we show that the transcriptional profiles of human and mouse neocortical RG are broadly conserved during neurogenesis, yet diverge for specific signalling pathways. By analysing differential gene co-expression relationships between the species, we demonstrate that the growth factor PDGFD is specifically expressed by RG in human, but not mouse, corticogenesis. We also show that the expression domain of PDGFRβ, the cognate receptor for PDGFD, is evolutionarily divergent, with high expression in the germinal region of dorsal human neocortex but not in the mouse. Pharmacological inhibition of PDGFD-PDGFRβ signalling in slice culture prevents normal cell cycle progression of neocortical RG in human, but not mouse. Conversely, injection of recombinant PDGFD or ectopic expression of constitutively active PDGFRβ in developing mouse neocortex increases the proportion of RG and their subventricular dispersion. These findings highlight the requirement of PDGFD-PDGFRβ signalling for human neocortical development and suggest that local production of growth factors by RG supports the expanded germinal region and progenitor heterogeneity of species with large brains.


Conflict of interest statement

The authors declare no conflict of interests.

Figures

Extended Data Figure 1
Extended Data Figure 1. Human brain dissection for GCASS and schematic for generation of FACS-mRG dataset
a, Top: To generate the GCASS dataset, an almost-intact prenatal human telencephalic hemisphere (GW14.5) was microdissected to separate the dorsal telencephalon from the ventral telencephalon (including medial and lateral ganglionic eminences). Bottom: The dorsal fragment was flash-frozen and serially sectioned (150 μm) for transcriptional profiling with Illumina HT-12 v4 Beadchip microarrays (scale bars 2.5 mm). b, To generate the FACS-mRG dataset, dorsal neocortices of Eomes:GFP mouse embryos were microdissected, pooled (n = 3 litters, 5-8 pooled embryos per litter), dissociated, and FACS-sorted according to the gating scheme depicted to isolate RG and IP cells. Transcriptional profiling of the resultant populations was performed using Illumina mouseRef-8 v1.0 Beadchip microarrays.
Extended Data Figure 2
Extended Data Figure 2. Genes comprising the six RG coexpression modules identified by GCASS are expressed in a manner consistent with the known distribution of RG in developing human neocortex
Six candidate hRG gene coexpression modules (Fig. 1d) were superimposed on three independent gene expression datasets generated from laser-microdissected samples from prenatal human cortex: ABI.1 (GW17), ABI.2 (GW18), and Fietz et al. (GW15-18) (as listed in Extended Data Table 1). The characteristic expression patterns of the superimposed modules were summarized by singular value decomposition; the first principal component (PC1) for each module in each dataset is shown. In all cases, PC1 revealed substantially higher expression levels for these genes in germinal zones (VZ, ISVZ, and OSVZ, highlighted in red) vs. non-germinal zones (IZ, SP, ICP, OCP, CP, MZ, SG). Permutation analysis indicated that the percent variance explained (VE) by PC1 of each superimposed module was significantly greater than expected by chance (n = 10,000 permutations). VZ: ventricular zone, ISVZ: inner subventricular zone, OSVZ: outer subventricular zone, IZ: intermediate zone, SP: subplate, ICP: inner cortical plate, OCP: outer cortical plate, CP: cortical plate, MZ: marginal zone, SG: subpial granular layer, GW: gestational week, CTX: cortex.
Extended Data Figure 3
Extended Data Figure 3. GCASS successfully predicts novel markers of neocortical hRG
a, Genome-wide distribution of predicted GW14.5 neocortical hRG expression specificity (Z.hRG). Red lines: predicted RG genes (validated in b-c). b-c, Immunostaining and in situ hybridization in GW14.5 human neocortex confirms RG expression specificity for novel candidate markers predicted in (a) (b, scale bar 50 μm; c, scale bar 100 μm). Analyzed tissue sections were independent from the sample used for microarray analysis (Fig. 1a). VZ: ventricular zone, (I/O)SVZ: (inner/outer) subventricular zone.
Extended Data Figure 4
Extended Data Figure 4. Workflow of bioinformatic procedures and experimental rationale for the entire study
The bioinformatic component of this study sought to identify a homologous gene coexpression signature for human and mouse RG cells that is robust across multiple sampling strategies/technology platforms and can be normalized to facilitate comparisons within and between species. This pipeline illustrates the steps that were taken to identify, integrate, and compare RG gene coexpression signatures in eight transcriptomic datasets generated from prenatal human and mouse neocortex.
Extended Data Figure 5
Extended Data Figure 5. Genome-wide predictions of expression specificity for hRG and mRG are robust across independent datasets
a-b, Heat maps of Spearman correlation coefficients for predicted RG expression specificity (RG.PR) over 10,929 genes present in all five human datasets (a) and 10,649 genes present in all three mouse datasets (b) (as indicated in columns BE and BI in Supplementary Table 3). Datasets are denoted by the sample ages listed in Extended Data Table 1, though factors besides age also contribute to the observed correlations (e.g. choice of technology platform, sample preparation strategy, etc.). E: embryonic, GW: gestational week.
Extended Data Figure 6
Extended Data Figure 6. In situ hybridization (ISH) validates predicted presence or absence of gene expression in hRG and mRG
a, Pink: human in situ probes for 6 genes predicted to be expressed by hRG but not mRG were generated and hybridized in GW15 human neocortical tissue to validate predicted hRG expression (human scale bar 200 μm). Blue (Eurexpress: http://www.eurexpress.org/ee/): in situ hybridizations for 13 genes predicted to be expressed by hRG but not mRG reveal no expression by mRG in E14.5 mouse cortex. Green: mouse in situ probes for 3 genes predicted to be expressed by hRG but not mRG were generated and revealed no expression by mRG (E13.5). Positive control expression in cells other than RG are labeled in red. b, Expression patterns of genes predicted to be expressed by mRG (i.e. those with the highest mRG.PR¯ values in Supplementary Table 3) are shown as further validation (Blue [E14.5, Eurexpress: http://www.eurexpress.org/ee/]; Orange [E14.5, GenePaint31: http://www.genepaint.org]; mouse scale bars ∼500 μm). One other gene in the top 15, Cks2, is not shown, but was validated by Ajioka et al., 200632.
Extended Data Figure 7
Extended Data Figure 7. PDGFD is expressed by neocortical RG during neurogenesis in humans, but not mice
a, In situ hybridization of PDGFD in GW14.5, 16.5, 17.3, and 18.2 human neocortex demonstrates consistent expression in RG across multiple ages (scale bar 200 μm). b, In situ hybridization of Pdgfd in E14.5 mouse (Eurexpress: http://www.eurexpress.org/ee/) demonstrates lack of expression (scale bar ∼500 μm). c, To demonstrate the lack of Pdgfd expression in mouse neocortex across multiple ages, a pCAG-PDGFD-IG expression plasmid was electroporated into the mouse VZ at E13.5 as an internal positive control and harvested at E14.5, E15.5, or E17.5. At E14.5 and E15.5, Pdgfd (blue signal) is seen only in the electroporated region in the ventricular zone (scale bar 200 μm, inset scale bar 50 μm). At E17.5, Pdgfd is in the cortical plate, and not in the ventricular zone or anywhere else (scale bar 500 μm, inset scale bar 50 μm). VZ: ventricular zone, (I/O)SVZ: (inner/outer) subventricular zone.
Extended Data Figure 8
Extended Data Figure 8. Pdgfrβ is strongly expressed by ventral RG and weakly expressed by lateral RG in mice
In situ hybridization of Pdgfrβ in sagittal sections through the mouse forebrain (E14.5) across a medial-lateral axis (Eurexpress: http://www.eurexpress.org/ee/) demonstrates progenitor expression in the ventral germinal regions. This expression extends into the dorsal cortex in the lateral aspect of the brain, but is not widespread. In contrast, no progenitor expression is detected in dorsomedial cortex (scale bar 500 μm, inset scale bar 100 μm). Expression is also detected in the pia and vascular pericytes. VZ: ventricular zone, SVZ: subventricular zone.
Extended Data Figure 9
Extended Data Figure 9. Manipulation of PDGFRß signaling in human and mouse neocortex
a-d, Chemical blockade of PDGFRß signaling in cultured slices of GW14.5 human neocortex impairs RG cell cycle progression. Four pharmacological inhibitors of PDGFRß signaling were screened at different concentrations to determine their effects on RG proliferation in cultured slices of GW17.5 human neocortex (2 days). Slices were treated with BrdU for the duration of the experiment and RG proliferation was quantified as the fraction of SOX2+ cells that incorporated BrdU following treatment with inhibitor or vehicle. Statistical significance was assessed with the Wilcoxon rank sum test using the wilcox.test R function with default settings. Images derived from ≥3 slices in each condition. Control + DMSO n = 18; control no DMSO n = 9; CP673451 all conc. n = 9; Sutent all conc. n = 6; Imatinib [0.1μM, 10μM] n = 9, [100μM] n = 6; Tivozanib [1μM, 10μM] n = 9, [0.1μM] n = 6. Significance indicated by: n.s. P > 0.05, **P ≤ 0.01, ***P ≤ 0.001, ****P ≤ 0.0001. e, Slice cultures of E13.5 mouse neocortex were treated with BrdU and DMSO (control) or a pharmacological inhibitor of PDGFRß signaling (CP673451) for 1 or 2 d (slices from at least 3 independent litters). RG (SOX2+) or IP (TBR2+) cell proliferation was assessed as the fraction each population that incorporated BrdU or was Ki67+ (1d: n = 10 [DMSO] vs. n = 9 [CP673451]; 2d: n = 11 [DMSO] vs. n = 9 [CP673451]). This experiment serves as a negative control to compare with the human. f, Ectopic PDGFRß signaling promotes RG identity in E13.5 mouse neocortex. In utero electroporation of constitutively active TEL-PDGFRβ was compared with control (mouse E13.5-E15.5) and assessed for the proportion and distribution of SOX2+ RG cells or Ki67+ progenitors (out of GFP+) in the cortical wall (quantified in g: at least n = 3 slices per embryo from 2 independent litters, n = 15 [control]; n = 18 [TEL-PDGFRβ] or [PDGFRβ:D850V]; scale bar 50 μm). Ki67+GFP+ cell quantification following PDGFRβ:D850V electroporation was performed in a similar fashion and is also shown. The spatial distributions of RG (GFP+SOX2+) in the cortical wall were assessed by quantitative image analysis (spanning ventricle to pia). The grey band delineates a 95% confidence interval for a test of equal univariate densities based on 10,000 permutations. All error bars represent mean +/- s.e.m. Statistical significance for the effects of treatment was calculated by ANOVA of multiple linear regression while controlling for individual (e) and litter (f) variability (significance indicated by: n.s. P > 0.05, *P ≤ 0.05, **P ≤ 0.01, ***P ≤ 0.001, ****P ≤ 0.0001). VZ: ventricular zone.
Figure 1
Figure 1. GCASS identifies a transcriptional signature of radial glia (RG) in human neocortex
Left Conceptual framework. a, Transcriptional profiling of serial sections (n = 87, Illumina HT12v4 microarrays) from a GW14.5 human neocortical specimen (scale bar 2.5 mm). b, Genes with similar expression patterns are grouped into modules, which may reflect cell typespecific gene coexpression. c, The transcriptional signature of a module is defined as a list of genes ranked by their correlation to the module eigengene. Right: Finding human RG modules. d, Six out of 55 modules were significantly enriched (Fisher's exact test) with the FACS-mRG gene set. Blue line: P = .05; red line: P = 9.1e-04 (Bonferroni correction). e, Genome-wide distribution of predicted GW14.5 neocortical RG expression specificity (Z.hRG) based on enriched modules in (d). f, ISH confirms RG expression specificity for novel RG genes from e (scale bar 300 μm). (I/O)SVZ: inner/outer subventricular zone, SP: subplate, CP: cortical plate.
Figure 2
Figure 2. Combined differential RG specificity / differential expression analysis identifies gene expression differences that distinguish neocortical RG between human and mouse
a, Predicted RG expression specificity for 15,576 homologous genes in human and mouse. b, The core transcriptional architecture of RG. Node size corresponds to connectivity. c, Idealized examples of four types of evolutionary change that could drive differences in predicted hRG and mRG expression specificity. d, Comparison of differential RG specificity and differential expression for homologous genes between human and mouse. Dashed grey lines delineate arbitrary thresholds (-20, 20) used to define quadrants (1-4) for enrichment analyses (Supplementary Table 4). Cyan circles highlight 18 genes predicted to be expressed in hRG but not mRG; one of these encodes the growth factor PDGFD (d', green square). Its cognate receptor PDGFRβ is also highlighted (d', red square).
Figure 3
Figure 3. PDGFD and PDGFRß are expressed in human but not mouse dorsal RG
Consensus Pearson correlations among expression levels of PDGFD (a, human), Pdgfd (b, mouse), PDGFRβ (e, human), or Pdgfrβ (f, mouse) and 10 genes with the highest RG.PR¯ c-d, ISH of PDGFD in human (c, scale bar 1 mm, inset scale bar 200 μm) and mouse neocortex (d, scale bar 200 μm, inset scale bar 50 μm). g, Immunostaining of PDGFRß in human neocortex (scale bar 1 mm). 63x image of lateral VZ demonstrates co-labeling of PDGFRß with pVIM- and SOX2-expressing RG (scale bar 10 μm). The pia and choroid plexus are absent due to human tissue processing. h, Immunostaining of PDGFRß in mouse neocortex (comparison with pVIM in the lateral ganglionic eminence [LGE]; scale bar 250 μm, inset scale bar 50 μm).
Figure 4
Figure 4. PDGFD/PDGFRß signaling is necessary for normal cell cycle progression of neocortical RG in humans and sufficient to promote RG identity in mice
a, GW17.5 human neocortical slice cultures were treated with BrdU and DMSO (control) or an inhibitor of PDGFRß signaling (CP673451) (scale bar 50 μm). The same experiment was performed in E13.5 mouse neocortical slice cultures (slices from at least 3 individuals/litters per species). b, RG (IP) proliferation was quantified as the fraction of SOX2+ (TBR2+) cells that incorporated BrdU after 48 hours. RG slice counts: human (n = 18 [DMSO] vs. n = 17 [CP673451]); mouse (n = 13 [DMSO] vs. n = 11 [CP673451]). IP slice counts: human (n = 12 [DMSO] vs. n = 10 [CP673451]); mouse (n = 11 [DMSO] vs. n = 9 [CP673451]). Cell death was quantified in human slices as the fraction of SOX2+ or BrdU+ cells that co-stained for cleaved-caspase 3 (n = 6 [DMSO] vs. n = 7 [CP673451]). c, In utero intraventricular injection of recombinant human PDGF-DD protein (mouse E13.5-E15.5). Brain tissue was stained for SOX2 and DAPI (scale bar 50 μm). d, Quantification of data from c in dorsomedial and lateral cortex (at least n = 3 slices per embryo from 5 litters/experiments [lateral: n = 49 vehicle; n = 47 PDGF-DD; dorsomedial: n = 45 vehicle; n = 39 PDGF-DD]). The distribution of RG in the cortex (from ventricle to pia) was quantified; grey band delineates 95% confidence interval for test of equal univariate densities (n = 10,000 permutations). e, In utero electroporation of constitutively active PDGFRβ:D850V (mouse E13.5-E15.5). Cortex was stained for SOX2; white arrowheads indicate co-labeling with electroporated GFP cells (quantified in f: at least n = 3 slices per embryo from 2 litters; n = 15 [control], n = 18 [PDGFRβ:D850V]; scale bar 50 μm). Note disrupted epithelial structure of VZ. Error bars = mean +/- s.e.m. Statistical significance for treatment was determined by ANOVA of multiple linear regression after controlling for individual (b) or litter (d, f) (n.s. P > 0.05, *P ≤ 0.05, **P ≤ 0.01, ***P ≤ 0.001, ****P ≤ 0.0001). g, Schematic summarizing experimental manipulations and results. LOF: loss-offunction, GOF: gain-of-function.

Comment in

References

    1. Rakic P. Evolution of the neocortex: a perspective from developmental biology. Nat Rev Neurosci. 2009;10(10):724. - PMC - PubMed
    1. Lui JH, Hansen DV, Kriegstein AR. Development and evolution of the human neocortex. Cell. 2011;146(1):18. - PMC - PubMed
    1. Smart IH, et al. Unique morphological features of the proliferative zones and postmitotic compartments of the neural epithelium giving rise to striate and extrastriate cortex in the monkey. Cereb Cortex. 2002;12(1):37. - PMC - PubMed
    1. Hansen DV, Lui JH, Parker PR, Kriegstein AR. Neurogenic radial glia in the outer subventricular zone of human neocortex. Nature. 2010;464(7288):554. - PubMed
    1. Fietz SA, et al. OSVZ progenitors of human and ferret neocortex are epithelial-like and expand by integrin signaling. Nat Neurosci. 2010 - PubMed

Publication types

Substances

Associated data