. 2015 Feb;21(1):231-8.
doi: 10.1017/S1431927614013579. Epub 2014 Nov 13.

X-ray microscopy as an approach to increasing accuracy and efficiency of serial block-face imaging for correlated light and electron microscopy of biological specimens

Affiliations

X-ray microscopy as an approach to increasing accuracy and efficiency of serial block-face imaging for correlated light and electron microscopy of biological specimens

Eric A Bushong et al. Microsc Microanal. 2015 Feb.

Abstract

The recently developed three-dimensional electron microscopic (EM) method of serial block-face scanning electron microscopy (SBEM) has rapidly established itself as a powerful imaging approach. Volume EM imaging with this scanning electron microscopy (SEM) method requires intense staining of biological specimens with heavy metals to allow sufficient back-scatter electron signal and also to render specimens sufficiently conductive to control charging artifacts. These more extreme heavy metal staining protocols render specimens light opaque and make it much more difficult to track and identify regions of interest (ROIs) for the SBEM imaging process than for a typical thin section transmission electron microscopy correlative light and electron microscopy study. We present a strategy employing X-ray microscopy (XRM) both for tracking ROIs and for increasing the efficiency of the workflow used for typical projects undertaken with SBEM. XRM was found to reveal an impressive level of detail in tissue heavily stained for SBEM imaging, allowing for the identification of tissue landmarks that can be subsequently used to guide data collection in the SEM. Furthermore, specific labeling of individual cells using diaminobenzidine is detectable in XRM volumes. We demonstrate that tungsten carbide particles or upconverting nanophosphor particles can be used as fiducial markers to further increase the precision and efficiency of SBEM imaging.

Keywords: upconverting nanoparticles.


Figures

Figure 1
Figure 1
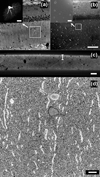
XRM allows for high-resolution imaging of tissue stained for SBEM. (a,b) While it is possible to easily identify anatomical features within a brain slice using light microscopy, the tissue is completely opaque to light following staining for SBEM. (c) A 2D projection image with the XRM using a 4× objective and 40 kV reveals details within the SBEM-stained tissue slice, including cell layers, vasculature, and white matter tracts. (d) A virtual 2D slice from a XRM volume allows for the discrimination of individual cells, dendrites, dark neurons, and nucleoli. The volume was collected with a 20× objective and using a 180° sample rotation and 0.1° tilt increments and 15 sec exposures (~7.5 hours total). (e) A 3D ray trace projection image of the same volume. Scale bar: (c) 500 µm, (d) 50 µm, and (e) 100 µm.
Figure 2
Figure 2
Finder grids are a simple method for tracking ROIs between XRM and SBEM modalities. (a) An EM finder grid was attached to the surface of a resin-embedded, SBEM stained slice of brain tissue. The grid landmarks are clearly visible in a computed slice from a XRM volume. (b) A second computed slice taken through the tissue shows that tissue structures are visible even in areas laying under areas of solid metal in the finder grid. The volume was collected using a 10× objective, with a 360° sample rotation at 0.2° tilt increments and 8 sec exposures (~4 hours total). Scale bar is 500 µm.
Figure 3
Figure 3
Specific-labeled of structures for EM is also visible in XRM volumes following staining for SBEM. (a) tdTomato labeling of RGC co-expressing MiniSOG. RGL: retinal ganglion cell layer, IPL: inner plexiform layer, INL: inner nuclear layer, OPL: outer plexiform layer, ONL: outer nuclear layer (b) Light microscopic image of the retina following photooxidation. Small area containing DAB-filled dendrites, corresponding to area in (a) is marked with dashed box. (c,d) Bright spots in XRM volume (arrows in left panels) from same area in (a) and (b) correspond to DAB-labeled dendrites in SBEM images (arrows in center panel, higher magnification in right panels). The XRM volume was collected using a ZEISS Xradia 510 Versa at 40 kV and 3 W power, 180° sample rotation at 0.1° tilt increments, with 10 sec exposure time (~6 hours total). Scale bar: (a) 50 µm, (c,d center panels) 10 µm, (c,d right panels) 2.5 µm.
Figure 4
Figure 4
Tungsten carbide particles are effective fiducial markers for precisely tracking ROIs from XRM to SBEM. (a) A photooxidized astrocyte in tissue stained for SBEM is visible in a computed slice from a XRM. Inset shows a confocal image of the astrocyte prior to photooxidation. XRM volume was collected at 20 kV and 2W power, with a 20× objective using 180° sample rotation with 0.1° tilt increments and 25 sec exposures (~13 hours total). (b) Another computed slice from the same volume shows the distribution of tungsten carbide particle on one surface of the sample. Inset shows SEM image of area in white box in (b), with several tungsten carbide particles visible. (c) Computed slice through cross section of the sample allows for determination of the depth of the astrocyte within the specimen. (d) SBEM slice taken from volume collected of the astrocyte, based on the coordinates calculated using tungsten carbide particles. The astrocyte is properly centered in field of view. Scale bar: (a inset) 15 µm, (b inset) 4 µm, (b) 100 µm, (c) 50 µm, (d) 10 µm.
Figure 5
Figure 5
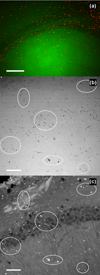
Nanophosphor particles are useful fiducial particles that can also be used to correlate ROIs between LM and XRM. (a) Nanophosphor particles (red) are distributed across a brain slice (green) using a gene gun. (b) Transmitted light image of nanophosphor particles on one surface of a brain slice. (c) Computed slice from XRM volume of same field of view as in (b). Volume was collected with 20× objective using 360° sample rotation with 0.2° tilt increments and 15 sec exposures (~7.5 hours total). Scale bar: (a) 200 µm, (b,c) 50 µm.

References

    1. Arkill KP, Qvortrup K, Starborg T, Mantell JM, Knupp C, Michel CC, Harper SJ, Salmon AH, Squire JM, Bates DO, Neal CR. Resolution of the three dimensional structure of components of the glomerular filtration barrier. BMC nephrology. 2014;15(1) article no. 24. - PMC - PubMed
    1. Auinger S, Small JV. Correlated light and electron microscopy of the cytoskeleton. Methods in cell biology. 2008;88:257–272. - PubMed
    1. Burnett TL, McDonald SA, Gholinia A, Geurts R, Janus M, Slater T, Haigh SJ, Ornek C, Almuaili F, Engelberg DL, Thompson GE, Withers PJ. Correlative tomography. Scientific reports. 2014;4 article no. 4711. - PMC - PubMed
    1. Deerinck T, Bushong E, Lev-Ram V, Shu X, Tsien R, Ellisman M. Enhancing serial block-face scanning electron microscopy to enable high resolution 3-D nanohistology of cells and tissues. Microscopy and Microanalysis. 2010;16(SupplementS2):1138–1139.
    1. Denk W, Horstmann H. Serial block-face scanning electron microscopy to reconstruct three-dimensional tissue nanostructure. PLoS biology. 2004;2(11):e329. - PMC - PubMed

Publication types

MeSH terms