. 2015 Feb 1;113(3):730-9.
doi: 10.1152/jn.00645.2014. Epub 2014 Nov 12.

Microstimulation of area V4 has little effect on spatial attention and on perception of phosphenes evoked in area V1

Affiliations

Microstimulation of area V4 has little effect on spatial attention and on perception of phosphenes evoked in area V1

Bruno Dagnino et al. J Neurophysiol. .

Abstract

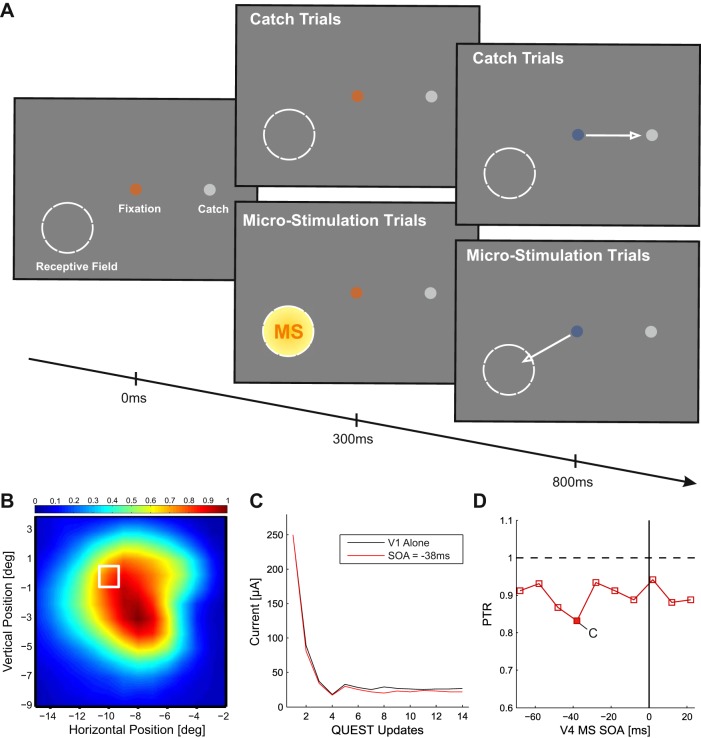
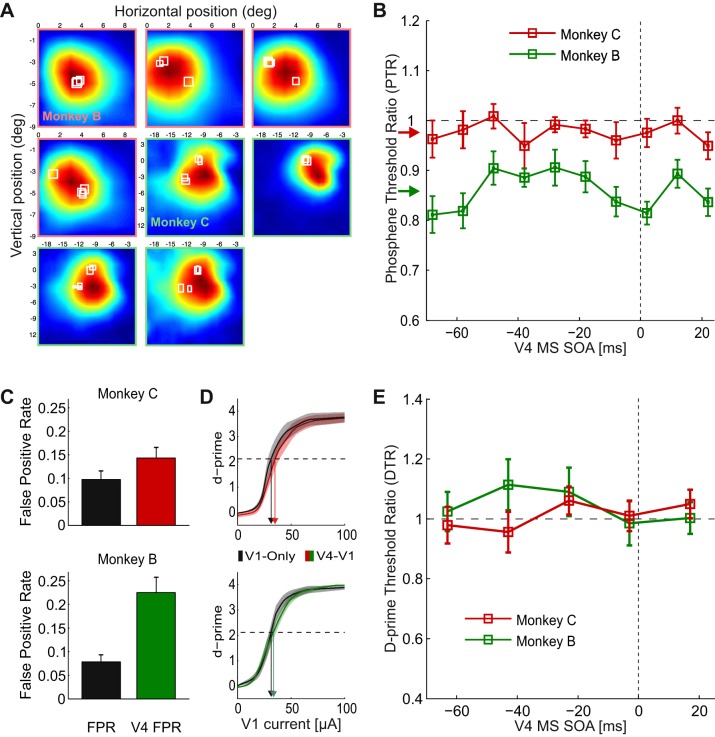
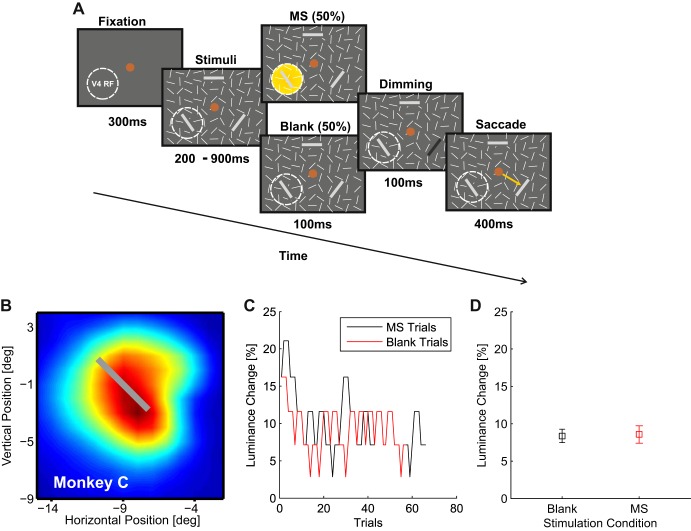
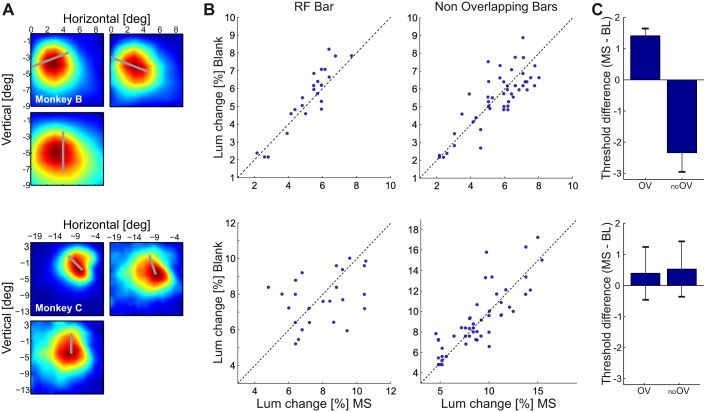
Previous transcranial magnetic stimulation (TMS) studies suggested that feedback from higher to lower areas of the visual cortex is important for the access of visual information to awareness. However, the influence of cortico-cortical feedback on awareness and the nature of the feedback effects are not yet completely understood. In the present study, we used electrical microstimulation in the visual cortex of monkeys to test the hypothesis that cortico-cortical feedback plays a role in visual awareness. We investigated the interactions between the primary visual cortex (V1) and area V4 by applying microstimulation in both cortical areas at various delays. We report that the monkeys detected the phosphenes produced by V1 microstimulation but subthreshold V4 microstimulation did not influence V1 phosphene detection thresholds. A second experiment examined the influence of V4 microstimulation on the monkeys' ability to detect the dimming of one of three peripheral visual stimuli. Again, microstimulation of a group of V4 neurons failed to modulate the monkeys' perception of a stimulus in their receptive field. We conclude that conditions exist where microstimulation of area V4 has only a limited influence on visual perception.

Keywords: area V1; area V4; cortico-cortical feedback; phosphenes; visual awareness; visual cortex.


Figures

Fig. 1.
Fig. 1.
Phosphene detection task. A: after an initial period of 300 ms of fixation, a train of pulses was delivered to V1 to evoke a phosphene at the retinotopic location of the receptive field (RF) of the stimulated cells (circle). We also presented a “catch dot” that was the target of the saccade on trials without microstimulation (MS). After a delay of 500 ms, the fixation point changed color, cuing the monkeys to make a saccade. Saccades to the RF in MS trials and to the catch dot on trials without MS were followed by a juice reward. B: overlap between RFs of stimulated neurons in V1 and V4 in an example session with monkey C. White square indicates the RF of the neurons in V1; the heatmap indicates the RF of the neurons in V4. C: example of QUEST staircase that was used to determine threshold of phosphenes elicited in V1 in the V1-only (black) condition and in the V1/V4-MS condition with a stimulus-onset asynchrony (SOA) of −38 ms (red). D: relationship between the phosphene threshold ratio (PTR) in V1 and the SOA between subthreshold MS in V4 and MS in V1. Negative values on x-axis indicate that V4-MS preceded V1-MS. y-Axis shows PTR, the ratio between V1-MS detection thresholds with and without V4-MS.
Fig. 2.
Fig. 2.
Influence of V4-MS on the detection of phosphenes evoked in V1. A: all combinations of V1- and V4-RFs for monkeys B and C that were tested in the double MS experiment. Color maps show V4-RFs, and white squares illustrate V1-RFs. Color scale as in Fig. 1B. B: average dependence of PTR in V1 on SOA across all sessions. Negative values on x-axis indicate that V4-MS preceded V1-MS. PTR is defined as the threshold with V4-MS expressed as a fraction of the threshold in V1 without V4-MS. Error bars indicate SE across sessions. Colored arrows on y-axis indicate PTRMean. C: false positive rate (FPR) is the fraction of the trials when monkeys made a saccade toward the RF in catch trials without (black bars) or with V4-MS (colored bars). Red, monkey C; green, monkey B. Error bars indicate SE across sessions. D: average d-prime as function of V1-MS current in the V1-only (black line) and the V4/V1 combined MS condition (colored line). Red, monkey C; green, monkey B. Shaded areas indicate SE across sessions. E: average dependence of V1 d-prime threshold ratio (DTR) on SOA across all sessions. Negative values on x-axis indicate that V4-MS preceded V1-MS. DTR is defined as the current in V1 that yields a d-prime value of 1 in trials with V4-MS expressed as the fraction of V1 current that yields a d-prime of 1 without V4-MS. Error bars indicate SE across sessions. In this analysis adjacent pairs of SOAs were combined in bins to have sufficient data for the computation.
Fig. 3.
Fig. 3.
Dimming detection task. A: after 300 ms of fixation, 3 larger bars were presented among smaller distractor bars. One of the larger bars overlapped with a V4-RF. In half of the trials a train of 20 pulses (total duration 100 ms) with a current corresponding to 50% of the phosphene detection threshold was delivered to V4. After the end of the pulse train, 1 of the bars dimmed for 100 ms and monkeys had to make a saccade toward this bar. The luminance decrement was controlled by a staircase that kept performance at 79.4%. B: overlap between the RF of the stimulated V4 recording site and the bar in an example session. Color scale as in Fig. 1B. C: staircases of an example session, both for the blank (i.e., no MS) and the MS condition with a bar in the stimulated V4-RF. D: thresholds for blank and MS conditions of the example session computed as the mean of the last 15 reversals. Error bars indicate SE of the staircases.
Fig. 4.
Fig. 4.
Effect of V4-MS on dimming detection thresholds. A: RFs of V4 recording sites in the dimming detection task relative to 1 of the target bars (gray bars). Color scale as in Fig. 1B. B: dimming detection thresholds for the V4-MS trials (x-axis) and the blank trials (y-axis) for the bar in the RF (left) and the 2 bars outside the RF (right) in monkey B (top) and monkey C (bottom). C: sessions with suprathreshold V4 stimulation (stimulation current was set at 200% of the threshold). We computed the difference between dimming detection thresholds (% contrast change) for bars overlapping with the stimulated V4-RF (OV) and nonoverlapping bars (no OV). Shown are average results of 3 sessions in monkey B and 2 sessions in monkey C.

References

    1. Bullier J, McCourt ME, Henry GH. Physiological studies on the feedback connection to the striate cortex from cortical areas 18 and 19 of the cat. Exp Brain Res 70: 90–98, 1988. - PubMed
    1. Butovas S, Schwarz C. Spatiotemporal effects of microstimulation in rat neocortex: a parametric study using multielectrode recordings. J Neurophysiol 90: 3024–3039, 2003. - PubMed
    1. Cohen MR, Maunsell JH. A neuronal population measure of attention predicts behavioral performance on individual trials. J Neurosci 30: 15241–15253, 2010. - PMC - PubMed
    1. Cohen MR, Maunsell JH. When attention wanders: how uncontrolled fluctuations in attention affect performance. J Neurosci 31: 15802–15806, 2011. - PMC - PubMed
    1. Dai J, Brooks DI, Sheinberg DL. Optogenetic and electrical microstimulation systematically bias visuospatial choice in primates. Curr Biol 24: 63–69, 2014. - PubMed

Publication types

LinkOut - more resources