. 2015 Jan;29(1):286-99.
doi: 10.1096/fj.14-263038. Epub 2014 Nov 12.

Cellular origins of cold-induced brown adipocytes in adult mice

Affiliations

Cellular origins of cold-induced brown adipocytes in adult mice

Yun-Hee Lee et al. FASEB J. 2015 Jan.

Abstract

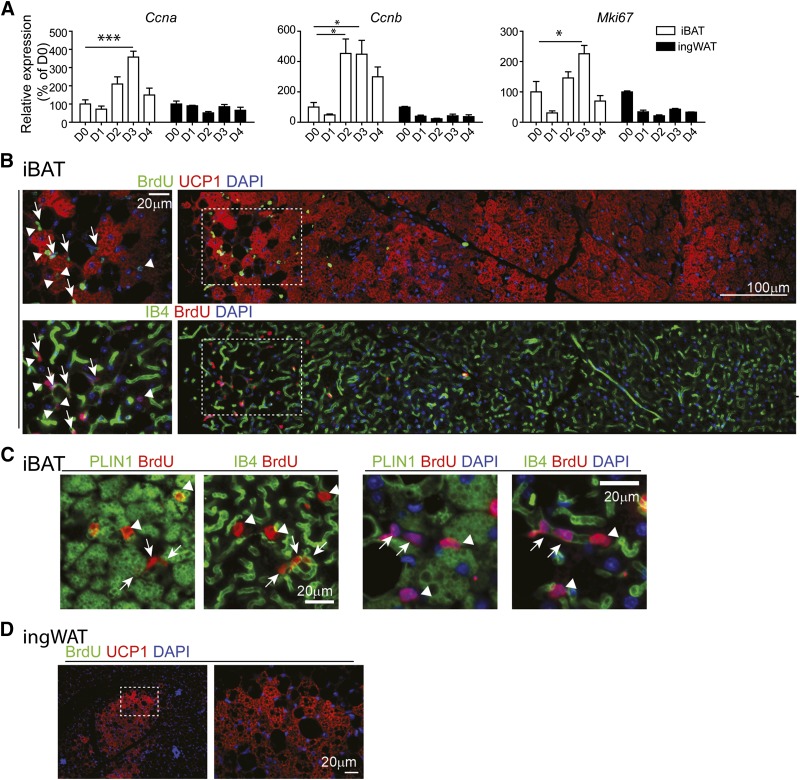
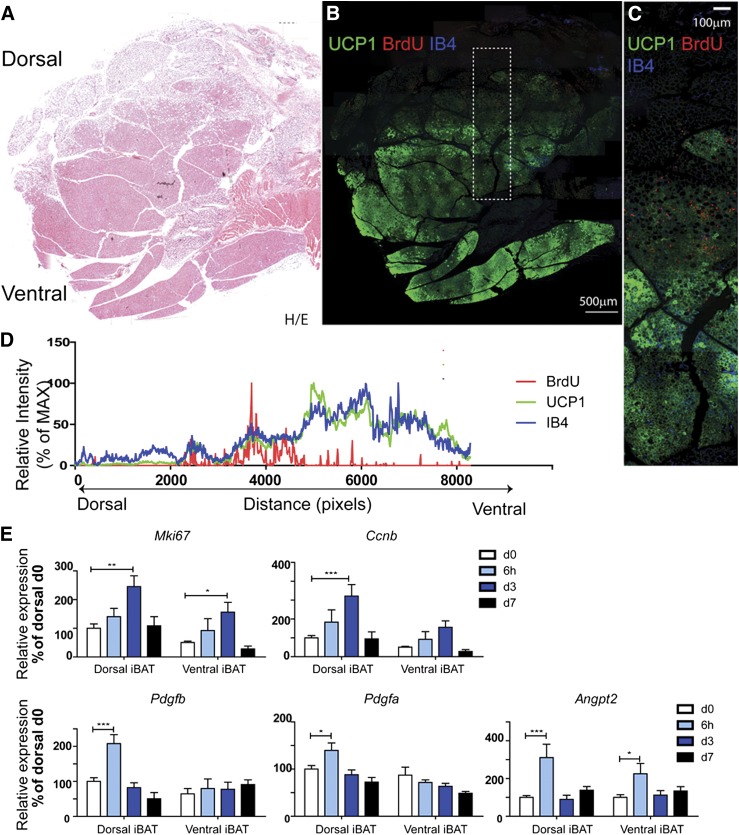
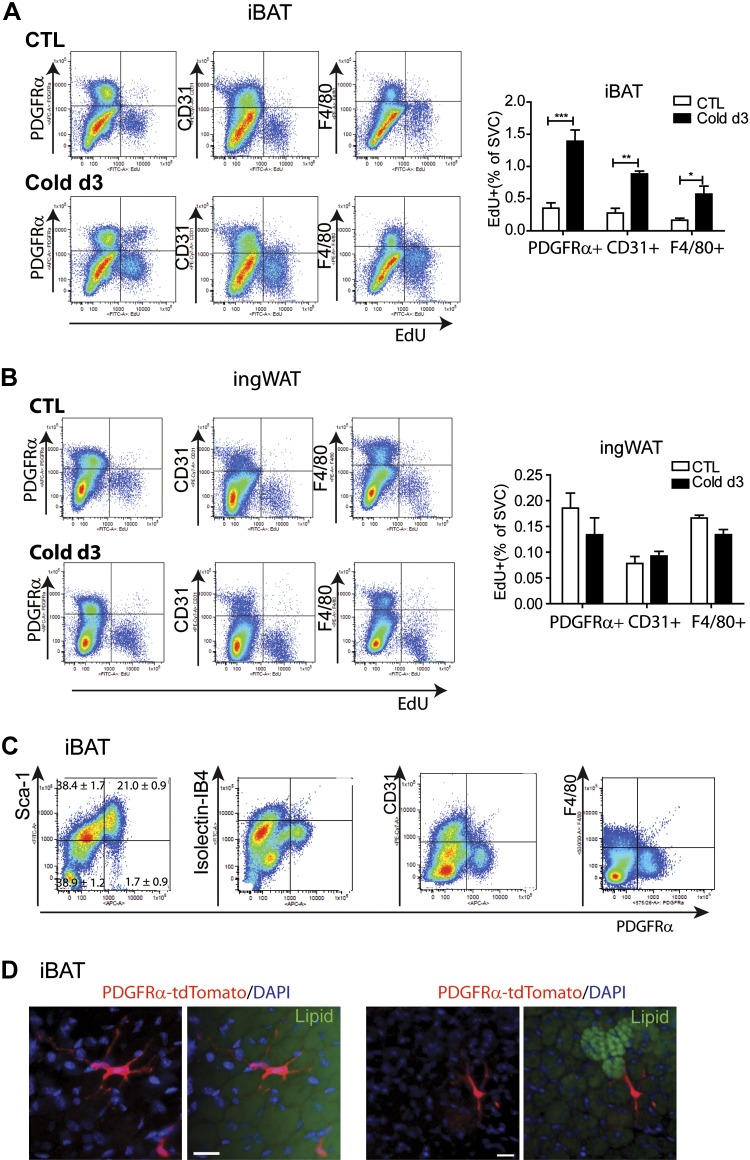
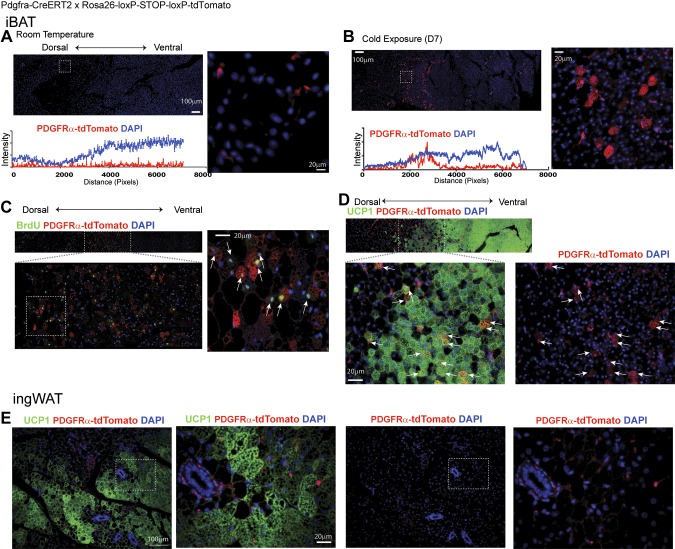
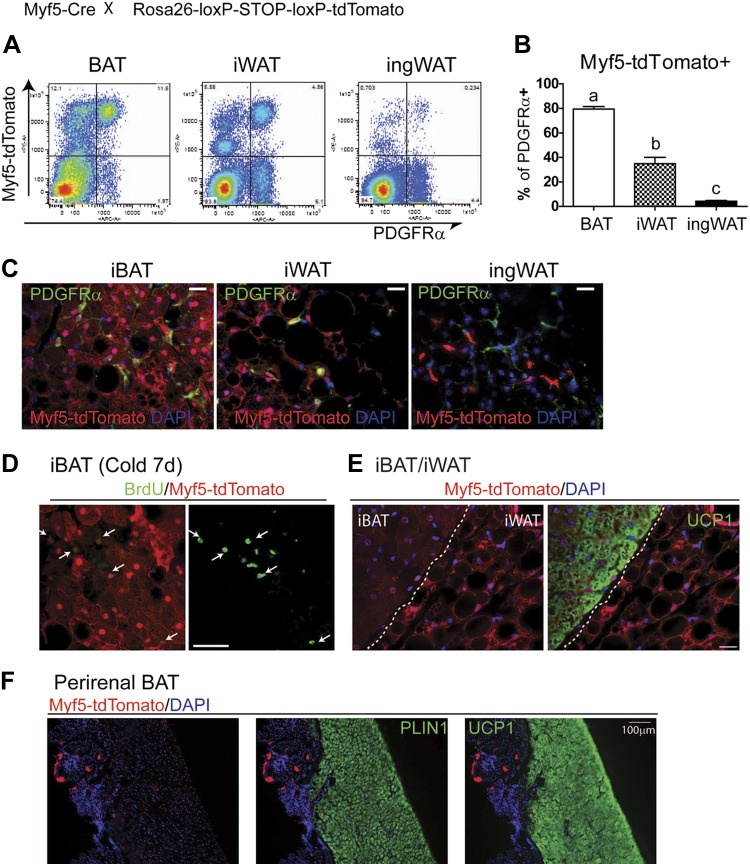
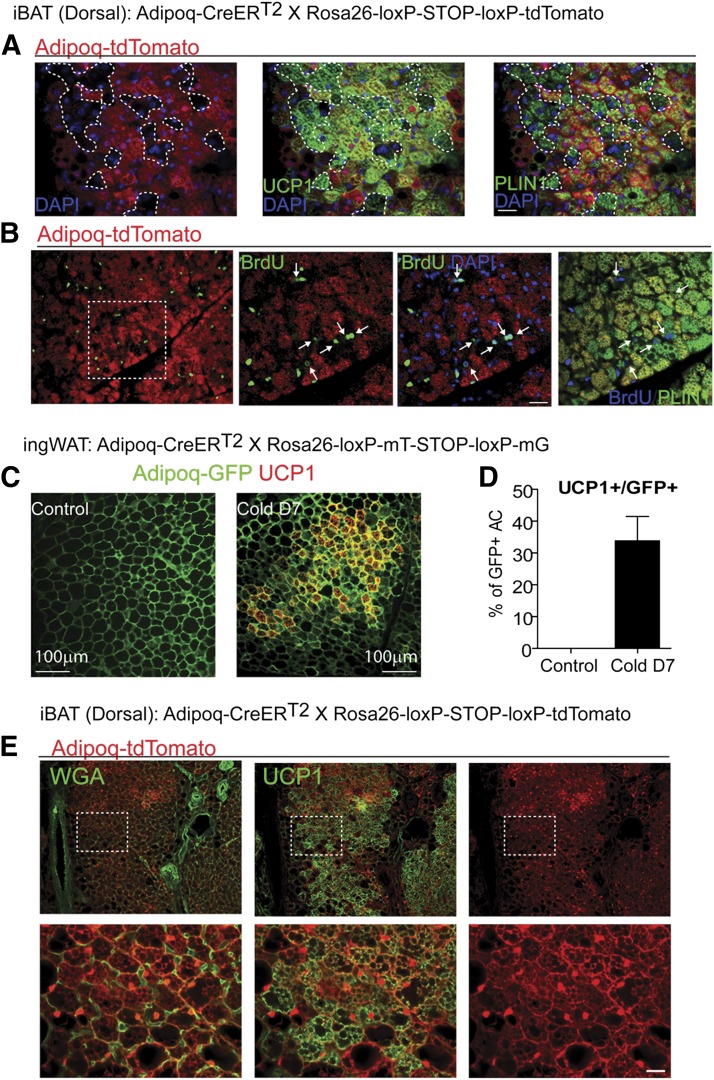
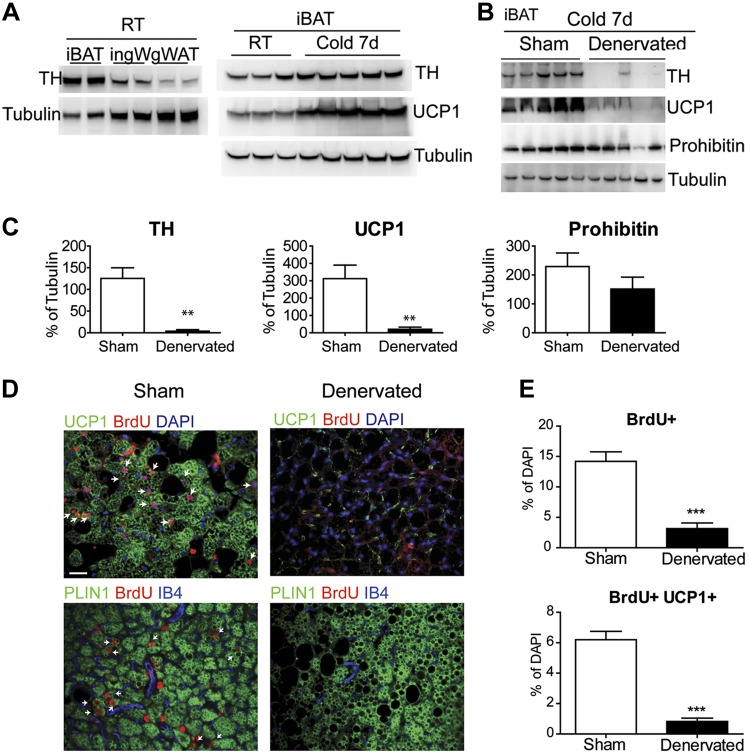
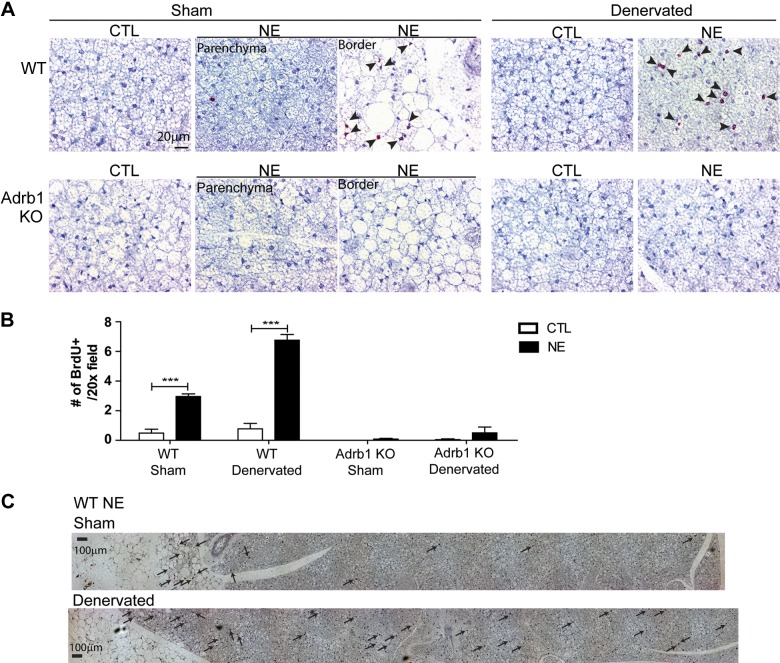
This work investigated how cold stress induces the appearance of brown adipocytes (BAs) in brown and white adipose tissues (WATs) of adult mice. In interscapular brown adipose tissue (iBAT), cold exposure increased proliferation of endothelial cells and interstitial cells expressing platelet-derived growth factor receptor, α polypeptide (PDGFRα) by 3- to 4-fold. Surprisingly, brown adipogenesis and angiogenesis were largely restricted to the dorsal edge of iBAT. Although cold stress did not increase proliferation in inguinal white adipose tissue (ingWAT), the percentage of BAs, defined as multilocular adipocytes that express uncoupling protein 1, rose from undetectable to 30% of total adipocytes. To trace the origins of cold-induced BAs, we genetically tagged PDGFRα(+) cells and adipocytes prior to cold exposure, using Pdgfra-Cre recombinase estrogen receptor T2 fusion protein (CreER(T2)) and adiponectin-CreER(T2), respectively. In iBAT, cold stress triggered the proliferation and differentiation of PDGFRα(+) cells into BAs. In contrast, all newly observed BAs in ingWAT (5207 out of 5207) were derived from unilocular adipocytes tagged by adiponectin-CreER(T2)-mediated recombination. Surgical denervation of iBAT reduced cold-induced brown adipogenesis by >85%, whereas infusion of norepinephrine (NE) mimicked the effects of cold in warm-adapted mice. NE-induced de novo brown adipogenesis in iBAT was eliminated in mice lacking β1-adrenergic receptors. These observations identify a novel tissue niche for brown adipogenesis in iBAT and further define depot-specific mechanisms of BA recruitment.

Keywords: Myf5; adipogenesis; innervation; lineage tracing; tyrosine hydroxylase.


Figures

Figure 1.
Figure 1.
Cold exposure induces cell proliferation of endothelial cells and recruits new BAs in BAT. A) Quantitative PCR analysis of proliferation-related genes in iBAT and ingWAT of control B6 mice and mice exposed to 4°C up to 4 d (n = 4–7 per condition; mean ± sem). *P < 0.05; ***P < 0.001. B–D) Representative images of paraffin sections of iBAT (B and C) and ingWAT (D) of mice infused with BrdU during 7 d of cold exposure. Regions of higher magnification (left panels in B and C, right panel in D) are outlined by dashed rectangles. B) Triple fluorescence staining for isolectin-IB4, UCP1, and BrdU indicates the appearance of new BAs (UCP1+BrdU+, arrowheads) and new endothelial cells (IB4+BrdU+, arrows) at the dorsal edge of iBAT, where UCP1+ and UCP1 adipocytes coexist. C) Paraffin sections of iBAT triply stained for isolectin-IB4, PLIN1, and BrdU. Left panels are the merged image of PLIN1 (green) with BrdU (red). Right panels merge images of isolectin-IB4 (green) and BrdU (red) fluorescence. Arrows indicate IB4+BrdU+ endothelial cells, whereas arrowheads indicate PLIN1+BrdU+ new adipocytes. D) Paraffin sections of ingWAT stained for BrdU and UCP1indicate that UCP1+ adipocytes in ingWAT were negative for BrdU. Nuclei were counterstained with DAPI. Scale bars, 20 or 100 µm as indicated.
Figure 2.
Figure 2.
Cold stress triggers cell proliferation at the dorsal edge of BAT that interfaces suprascapular WAT. A and B) Histologic analysis of BrdU incorporation in iBAT during cold exposure. Adjacent paraffin sections were stained for H/E (A), or BrdU, isolectin-IB4, and UCP1 (B). Scale bar, 500 µm. C) Magnified view of boxed region from (B). Scale bar, 100 µm. D) Analysis of fluorescence intensity of (C) indicated that cell proliferation (BrdU-Red) concentrated at the dorsal edge of BAT, where UCP1 expression and vascular density drop. MAX, maximum. E) Quantitative PCR analysis of proliferation- and angiogenesis-related gene expression in dorsal and ventral BAT of control mice and mice exposed to 4°C up to 7 d (n = 6, mean ± sem). *P < 0.05; **P < 0.01;***P < 0.001.
Figure 3.
Figure 3.
Effect of cold exposure on cell proliferation in various adipose depots. A and B) Flow cytometric analysis of proliferating cell populations in various adipose depots. Representative flow cytometric profile of EdU incorporation by cells expressing PDGFRα, CD31, and F4/80 along with quantification of 3–4 independent experiments (mean ± sem). *P < 0.05; **P < 0.01; ***P < 0.001. CTL, control. Cold exposure induced the highest mitogenic responses of PDGFRα+ cells and endothelial cells in iBAT, whereas cold exposure had no effect on cell proliferation in ingWAT. C) Flow cytometric analysis of cell surface marker expression in PDGFRα+ cells in SVCs obtained from iBAT. D) Representative images of PDGFRα+ cells in whole-mount iBAT from tamoxifen-induced Pdgfra-CreERT2/Rosa26-loxP-stop-loxP-tdTomato mice. Lipid (green) was stained with HCS LipidTOX. Scale bars, 20 µm.
Figure 4.
Figure 4.
Lineage tracing demonstrates that proliferating PDGFRα+ cells give rise to BAs during cold exposure. Representative images of paraffin sections of iBAT (A–D) and ingWAT (E) of Pdgfra-CreERT2/Rosa26-loxP-stop-loxP-tdTomato induced with tamoxifen and kept at room temperature (A) and 4°C (B–E) for 7 d. High-magnification images of boxed regions are provided in each panel. A) tdTomato+ staining of iBAT from mice housed at room temperature (RT) identified PDGFRα+ progenitors in iBAT. B) Cold exposure triggered the appearance of numerous tdTomato+ multilocular adipocytes near the dorsal edge of iBAT. Analysis of fluorescence intensity indicated that PDGFRα+ progenitors are evenly distributed throughout the tissue. A high-magnification view of the boxed region clearly demonstrates multilocular morphology of tdTomato+ adipocytes. C) Representative images of paraffin sections stained for BrdU and tdTomato. Arrows in high magnification indicate BrdU+tdTomato+ adipocytes. D and E) Representative images of paraffin sections stained for UCP1 and tdTomato. D) Arrows in high-magnification image indicate UCP1+tdTomato+ adipocytes in iBAT. E) UCP1+ adipocytes in ingWAT were negative for tdTomato. Nuclei were counterstained with DAPI (n = 4 per condition). Scale bars, 20 or 100 µm as indicated.
Figure 5.
Figure 5.
Lineage tracing of Myf5-derived cells in various adipose tissue depots. A and B) Flow cytometric analysis of contribution of Myf5+ lineage-derived cells to PDGFRα expressing cells in iBAT, iWAT, and ingWAT from Myf5Cre/Rosa26-loxP-STOP-loxP-tdTomato mice (n = 3). Significant differences (P < 0.001) are indicated by different letters (a, b, and c). C) Representative images of cryosections of iBAT, iWAT, and ingWAT of Myf5Cre/Rosa26-loxP-STOP-loxP-tdTomato mice stained for PDGFRα. D and E) Cryosections of BAT and WAT from Myf5Cre/Rosa26-loxP-STOP-loxP-tdTomato mice. D) New BAs labeled by BrdU were positive for previous Myf5 expression 7 d after cold exposure. E) Uniform Myf5 reporter (tdTomato) expression in UCP1+ BAs in iBAT and UCP1 white adipocytes in adjacent iWAT. F) Absence of Myf5 reporter expression in most UCP1+ BAs in perirenal adipose tissue. Scale bars, 20 µm.
Figure 6.
Figure 6.
Tracking of mature adipocytes confirms that BA recruitment in BAT involves de novo adipogenesis, whereas new BAs in ingWAT are derived from preexisting unilocular adipocytes. A and B) Representative images of paraffin sections of iBAT of Adipoq-CreERT2/Rosa26-loxP-stop-loxP-tdTomato mice induced with tamoxifen and kept at 4°C for 7 d, stained for tdTomato, Plin1, and UCP1 (A) or BrdU (B). Numerous tdTomato multilocular adipocytes (tdTomatoPlin1+UCP1+ and tdTomatoPlin+BrdU+) appeared at the dorsal edge of iBAT. tdTomato adipocyte clusters are surrounded by dotted lines in (A) or indicated by arrows in (B). C) Representative images of paraffin sections of iBAT of Adipoq-CreER/Rosa26-loxP-mT- STOP-loxP-mG induced with tamoxifen and kept at room temperature or 4°C for 7 d, stained for UCP1 and GFP. D) Quantification of UCP1+ adipocytes (Control, n = 3; Cold d7, n = 5; mean ± sem). E) Representative images of paraffin sections of ingWAT of Adipoq-CreER T2/Rosa26-loxP-stop-loxP-tdTomato induced with tamoxifen and kept at room temperature or 4°C for 7 d, stained for UCP1 and tdTomato. Plasma membranes were stained with WGA. All UCP1+ adipocytes were derived from preexisting adipocytes that previously expressed adiponectin. Scale bars, 20 or 100 µm as indicated.
Figure 7.
Figure 7.
Surgical denervation prevents cold-induced BA recruitment in iBAT. A) TH protein levels in iBAT, ingWAT, and gonadal WAT (gWAT) in mice housed at room temperature (RT). Effect of 7 day cold exposure on TH and UCP1 levels in iBAT. B) Surgical denervation of iBAT abolished TH and UCP1 induction during cold stress. RT, room temperature. C) Quantification of protein levels from (B). D) Immunofluorescence staining of paraffin sections of iBAT of mice kept at 4°C for 7 d, stained for BrdU and UCP1 or PLIN1. Arrows indicate double-positive cells. E) Quantification of BrdU+ cells in paraffin sections. Scale bar, 20 µm.
Figure 8.
Figure 8.
Adrb1 is required for new BA recruitment from progenitor proliferation in iBAT. A) Representative images of paraffin sections of iBAT from wild-type mice and Adrb1 KO mice infused with NE or vehicle for 7 d. NE treatment significantly increased cell proliferation in control and surgically denervated iBAT of wild-type (WT) mice, whereas NE treatment failed to induce cell proliferation in intact and denervated iBAT of Adrb1 KO mice. B) Quantification of BrdU+ cells in paraffin sections (WT CTL, n = 6; WT NE, n = 4; KO CTL, n = 6; KO NE, n = 5; mean ± sem). ***P < 0.001. C) Representative images of paraffin sections of intact or denervated iBAT from wild-type mice infused with NE for 7 d. Arrows indicate location of BrdU+ cells. Scale bars, 20 or 100 µm as indicated.

References

    1. Cannon B., Nedergaard J. (2004) Brown adipose tissue: function and physiological significance. Physiol. Rev. 84, 277–359 - PubMed
    1. Gesta S., Tseng Y. H., Kahn C. R. (2007) Developmental origin of fat: tracking obesity to its source. Cell 131, 242–256 - PubMed
    1. Himms-Hagen J. (1990) Brown adipose tissue thermogenesis: interdisciplinary studies. FASEB J. 4, 2890–2898 - PubMed
    1. Stanford K. I., Middelbeek R. J. W., Townsend K. L., An D., Nygaard E. B., Hitchcox K. M., Markan K. R., Nakano K., Hirshman M. F., Tseng Y.-H., Goodyear L. J. (2013) Brown adipose tissue regulates glucose homeostasis and insulin sensitivity. J. Clin. Invest. 123, 215–223 - PMC - PubMed
    1. Bartelt A., Bruns O. T., Reimer R., Hohenberg H., Ittrich H., Peldschus K., Kaul M. G., Tromsdorf U. I., Weller H., Waurisch C., Eychmüller A., Gordts P. L., Rinninger F., Bruegelmann K., Freund B., Nielsen P., Merkel M., Heeren J. (2011) Brown adipose tissue activity controls triglyceride clearance. Nat. Med. 17, 200–205 - PubMed

Publication types

MeSH terms

Substances