. 2015 Jan;43(Database issue):D812-7.
doi: 10.1093/nar/gku1073. Epub 2014 Nov 11.

The UCSC Cancer Genomics Browser: update 2015

Affiliations

The UCSC Cancer Genomics Browser: update 2015

Mary Goldman et al. Nucleic Acids Res. 2015 Jan.

Abstract

The UCSC Cancer Genomics Browser (https://genome-cancer.ucsc.edu/) is a web-based application that integrates relevant data, analysis and visualization, allowing users to easily discover and share their research observations. Users can explore the relationship between genomic alterations and phenotypes by visualizing various -omic data alongside clinical and phenotypic features, such as age, subtype classifications and genomic biomarkers. The Cancer Genomics Browser currently hosts 575 public datasets from genome-wide analyses of over 227,000 samples, including datasets from TCGA, CCLE, Connectivity Map and TARGET. Users can download and upload clinical data, generate Kaplan-Meier plots dynamically, export data directly to Galaxy for analysis, plus generate URL bookmarks of specific views of the data to share with others.


Figures

Figure 1.
Figure 1.
TCGA LGG (n = 525) and GBM genomics (n = 587) datasets showing a common molecular subtype of similar copy number variation profile for both LGG (red box, panel A) and GBM IDH wild-type patients (panel B). In each panel the genomic heatmap is on the left and the clinical heatmap is on the right. Copy number datasets use red and blue to represent amplification and deletion, respectively. Black color for the IDH mutation feature indicates wild-type IDH. For all columns showing mutation status, yellow indicates that a non-silent somatic mutation (nonsense, missense, frame-shift indels, splice site mutations, stop codon read-throughs, change of start codon, in-frame indels) was identified in the protein-coding region of a gene and black shows that none of these previous mutation calls were identified. Gray represents no data. A bookmark of this view is at https://genome-cancer.ucsc.edu/proj/site/hgHeatmap/#?bookmark=ff9e8550141e6f37e3ec242152066914 (A) TCGA LGG whole-genome copy number variation. Left-most column in the clinical heatmap shows the consensus clustering assignment with Cluster 1 as yellow, Cluster 2 as green and Cluster 3 as black. Note that Cluster 2 is mostly IDH wild type. The next column shows IDH1 or IDH2 mutants and third column shows TP53 mutation. The last column shows tumor grade with light orange being grade 2 and dark orange being grade 3. (B) TCGA GBM whole-genome copy number variation. Left-most column in the clinical heatmap shows IDH1 mutation status. Unlike the LGG cohort, the GBM cohort harbors mutations in IDH1 and not in IDH2. The second column shows the glioma-CpG island methylator phenotype (G-CIMP) with light blue representing G-CIMP tumors and dark blue indicating that it is not characterized as a G-CIMP tumor.
Figure 2.
Figure 2.
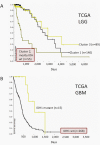
TCGA LGG and GBM datasets showing differential survival. It demonstrates that IDH wild-type subtypes in both cancers have worse prognosis compared to the rest of the tumors of the same cancer type. Time (X-axis) for both panels is in days. (A) Kaplan–Meier plot for TCGA LGG cohort. Patients grouped by consensus clustering assignment with Cluster 1 as yellow, Cluster 2 (mostly IDH wild type) as green and Cluster 3 as black. (B) Kaplan–Meier plot for TCGA GBM cohort. Patients clustered by IDH1 mutation status with yellow indicating that a non-silent somatic mutation (nonsense, missense, frame-shift indels, splice site mutations, stop codon read-throughs, change of start codon, in-frame indels) was identified in the protein-coding region of a gene and black indicating that none of these mutations were identified.

References

    1. Hanahan D., Weinberg R.A. Hallmarks of cancer: the next generation. Cell. 2011;144:646–674. - PubMed
    1. Wilks C., Cline M.S., Weiler E., Diehkans M., Craft B., Martin C., Murphy D., Pierce H., Black J., Nelson D., et al. The Cancer Genomics Hub (CGHub): overcoming cancer through the power of torrential data. Database. 2014;2014 doi:10.1093/database/bau093. - PMC - PubMed
    1. Chin L., Hahn W.C., Getz G., Meyerson M. Making sense of cancer genomic data. Genes Dev. 2011;25:534–555. - PMC - PubMed
    1. Chin L., Andersen J.N., Futreal P.A. Cancer genomics: from discovery science to personalized medicine. Nat. Med. 2011;17:297–303. - PubMed
    1. Merali Z. Computational science: …Error. Nature. 2010;467:775–777. - PubMed

Publication types