. 2015 Jan;43(2):e10.
doi: 10.1093/nar/gku1094. Epub 2014 Nov 11.

Mechismo: predicting the mechanistic impact of mutations and modifications on molecular interactions

Affiliations

Mechismo: predicting the mechanistic impact of mutations and modifications on molecular interactions

Matthew J Betts et al. Nucleic Acids Res. 2015 Jan.

Abstract

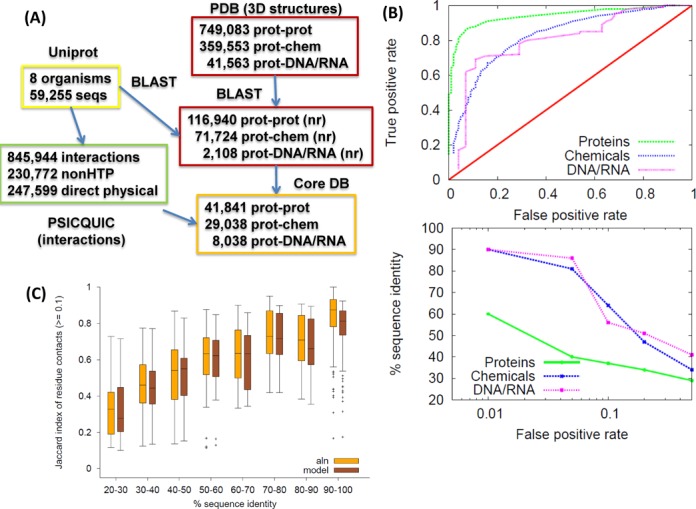
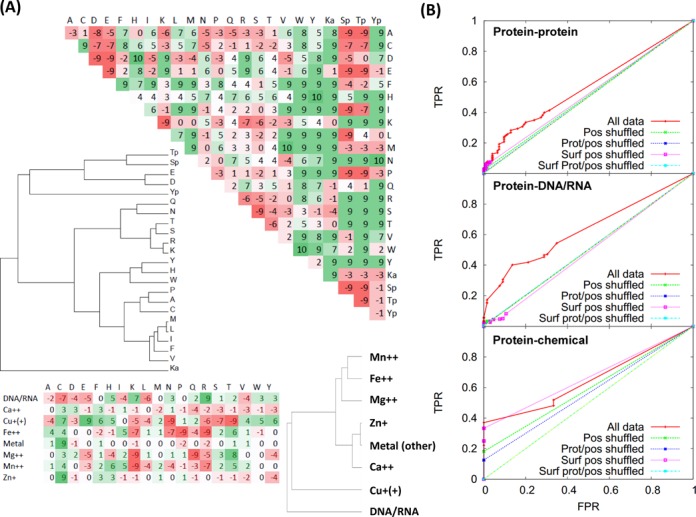
Systematic interrogation of mutation or protein modification data is important to identify sites with functional consequences and to deduce global consequences from large data sets. Mechismo (mechismo.russellab.org) enables simultaneous consideration of thousands of 3D structures and biomolecular interactions to predict rapidly mechanistic consequences for mutations and modifications. As useful functional information often only comes from homologous proteins, we benchmarked the accuracy of predictions as a function of protein/structure sequence similarity, which permits the use of relatively weak sequence similarities with an appropriate confidence measure. For protein-protein, protein-nucleic acid and a subset of protein-chemical interactions, we also developed and benchmarked a measure of whether modifications are likely to enhance or diminish the interactions, which can assist the detection of modifications with specific effects. Analysis of high-throughput sequencing data shows that the approach can identify interesting differences between cancers, and application to proteomics data finds potential mechanistic insights for how post-translational modifications can alter biomolecular interactions.


Figures

Figure 1.
Figure 1.
(A) Schematic of the data sources and pipeline. Numbers from the PDB (3D structures) at the top denote the complete set of interactions of each type, the second list (nr) refer to those that are non-redundant when grouping identical sequences. The final numbers (Mechismo Core DB) are those with the least stringent filtering criteria, though still requiring some sequence similarity and knowledge of protein–protein interactions (weakest). The totals without any filtering are 2 952 035 protein–protein, 51 182 protein–chemical and 13 186 protein–DNA/RNA, which in practice are only useful with species with small genomes and/or lacking structure data (e.g. yeast and bacterial species). (B) ROC curves (top) for predicting sites at protein, chemical and DNA/RNA interfaces, plotted by modifying the sequence identity threshold and reporting FPR/TPR. The associated values of sequence identity for key FPRs derived from this plot are shown in the plot below. (C) Box-plots (Tukey) showing contacts preserved (Jaccard index) versus sequence identity for protein–protein interactions where contacts are either inferred using an alignment to a 3D template (aln) or taken from a model of the interface constructed by homology modelling. For the box-plots we ignored datapoints where the Jaccard index was <0.1, as these denote different interfaces. Equivalent plots for protein–chemical and protein–DNA/RNA are shown in Supplementary Figure S1.
Figure 2.
Figure 2.
(A) Log-odds scores for amino acid side-chains interacting with other side-chains (top) and DNA/RNA and chemicals for which appropriate parameters are available (bottom). Values are multiplied by 10 and stripped of decimals for clarity, and are coloured red if unfavourable and green if favourable, with darker colours indicating stronger values. Modified amino acids are given as: Ka, acetyllysine; Sp/Tp/Yp, phospho-serine/threonine/tyrosine. Note that this is not a mutation or substitution matrix, but a measure of residue–residue interactions. The dendrograms show means clustered groups using distances between amino acids/molecules calculated by summing the absolute differences between matrix values. (B) ROC curves showing how accurate the direction of interaction effect is predicted based on a data set human mutations with annotated in Uniprot for disabling/enabling effects on protein, chemical or DNA/RNA interactions. ‘All data’ denotes the data set, with various shuffled data sets also shown: Pos denotes different positions in the same protein, Prot/pos denotes different proteins and positions and Surf denotes where accessibility values are maintained between the original data set and the shuffle.
Figure 3.
Figure 3.
(A) Network of RhoA and interaction partners showing the predicted effect of each mutation on a selection of interaction partners with structures sharing very high sequence identities with the human protein. Green lines show interactions where RhoA mutations are predicted to enhance the interaction; red lines where they diminish. Proteins linked with thin lines are those that interact with RhoA via an interface of known structure that does not involve the mutation. Tick/cross marks denote whether the proposed effect was observed in the two-hybrid tests. (B) Structures of RhoA mutation L69R in contact with three interactors. Proteins are shown as C-alpha trace with residue side-chains shown as wireframe (carbon = grey; oxygen = red; nitrogen = blue). Red labels show the location of the mutated RhoA residue; black those with which it is interacting on the other protein. Red circles indicate a disabling prediction, green an enabling one.
Figure 4.
Figure 4.
Variants in HTS cancer data sets. (A) Portions of the wider network of interactions involving proteins (red if mutated, grey if not), chemicals (magenta) and DNA/RNA (blue) affected by mutations identified after sequencing Medulloblastoma tumors (43) and Pancreatic cancer (B). The size of the red protein nodes is proportional to the number of variants contained within them, the size of chemical and DNA/RNA nodes is proportional to the number of sites predicted to interact with them, and the width of edges is proportional to the number of sites affecting them. Red edges are those where the effect of the mutations is predicted to diminish the interaction, green to enhance and orange where different mutations have opposite effects. (C) Structures of DDX3X showing Medulloblastoma mutations affecting DNA or ATP-binding, and (D) mutations in Pancreatic cancer affecting functional interactions of TP53 with DNA and TP53BP2. Networks and protein structures are displayed as described in Figure 3.
Figure 5.
Figure 5.
Mechismo as an aid to deleterious mutation predictions. (A) Distribution of Mechismo mutation scores for deleterious (red) and neutral (green) sites within a benchmark data set for deleterious site prediction. (B) ROC curve showing the effect of combining Mechismo and Polyphen2 scores to the same data set.

References

    1. Kilpivaara O., Aaltonen L.A. Diagnostic cancer genome sequencing and the contribution of germline variants. Science. 2013;339:1559–1562. - PubMed
    1. Choudhary C., Mann M. Decoding signalling networks by mass spectrometry-based proteomics. Nat. Rev. Mol. Cell Biol. 2010;11:427–439. - PubMed
    1. Pieper U., Webb B.M., Barkan D.T., Schneidman-Duhovny D., Schlessinger A., Braberg H., Yang Z., Meng E.C., Pettersen E.F., Huang C.C., et al. ModBase, a database of annotated comparative protein structure models, and associated resources. Nucleic Acids Res. 2011;39:D465–D474. - PMC - PubMed
    1. Mosca R., Céol A., Aloy P. Interactome3D: adding structural details to protein networks. Nat. Methods. 2013;10:47–53. - PubMed
    1. Tuncbag N., Gursoy A., Guney E., Nussinov R., Keskin O. Architectures and functional coverage of protein-protein interfaces. J. Mol. Biol. 2008;381:785–802. - PMC - PubMed

Publication types