On the origin of sex chromosomes from meiotic drive
- PMID: 25392470
- PMCID: PMC4262170
- DOI: 10.1098/rspb.2014.1932
On the origin of sex chromosomes from meiotic drive
Abstract
Most animals and many plants make use of specialized chromosomes (sex chromosomes) to determine an individual's sex. Best known are the XY and ZW sex-determination systems. Despite having evolved numerous times, sex chromosomes present something of an evolutionary puzzle. At their origin, alleles that dictate development as one sex or the other (primitive sex chromosomes) face a selective penalty, as they will be found more often in the more abundant sex. How is it possible that primitive sex chromosomes overcome this disadvantage? Any theory for the origin of sex chromosomes must identify the benefit that outweighs this cost and enables a sex-determining mutation to establish in the population. Here we show that a new sex-determining allele succeeds when linked to a sex-specific meiotic driver. The new sex-determining allele benefits from confining the driving allele to the sex in which it gains the benefit of drive. Our model requires few special assumptions and is sufficiently general to apply to the evolution of sex chromosomes in outbreeding cosexual or dioecious species. We highlight predictions of the model that can discriminate between this and previous theories of sex-chromosome origins.
Keywords: evolution; mathematical model; population genetics; segregation.
© 2014 The Author(s) Published by the Royal Society. All rights reserved.
Figures

 ,
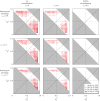
,  . The region in white represents the existence of a polymorphism at the drive locus B. For each combination of parameter values, red dots indicate that a male-determining allele increases in frequency when rare and becomes established in the population at the frequency indicated in the legend.
 and
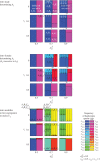
and  , and viability regime v11 = v12 = 1.0, v22 = 0.5). In step 1, a rare male-determining allele, A2, is introduced at a locus that is completely linked (r1 = 0) to the drive locus. In step 2, a rare female-determining allele, A3, which is recessive to the male-determining allele A2, is introduced. The male- and female-determining alleles force A1 to extinction. In step 3, a rare suppressor of male drive, C2, is introduced at a locus that freely recombines with the drive locus. The modifier allele, C2, forces the non-modifying allele, C1, to extinction. An XY sex-determination system evolves with haplotype A2B2C2 acting as a Y-chromosome and haplotype A3B1C2 acting as an X-chromosome. In the bottom row, the plots depict how analogous steps lead to the evolution of a ZW sex-determination system when the initial polymorphism involves a female-limited driver.
 , and the viability regime remains the same: v11 = v12 = 1.0, v22 = 0.5. For each of the three steps leading to the formation of sex chromosomes, every row of a plot corresponds to a different value of recombination between the sex-determining locus A and the meiotic drive locus B ranging from no recombination, r1 = 0, to free recombination r1 = 0.5. Every column corresponds to a different value of drive in males ranging from fair segregation,
  , to strong drive,
  .
.
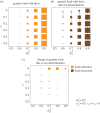
 , and the vertical axis corresponds to recombination between the drive and the sex-determining loci. Segregation is fair in females,
  , and the viability regime is v11 = v12 = 1.0, v22 = 0.5. The genetic load accrued by males and females is presented in separate plots and is depicted by the area of the squares within each. (a) The genetic load in a population at equilibrium when there is drive but no sex-determining alleles. With stronger drive in males,
  , the driving allele is more common and the genetic load is greater. (b) The genetic load in a population at equilibrium when there is a drive polymorphism and sex-determining alleles (A2 and A3). The stronger the drive,
  , the greater is the genetic load. Increases in recombination have opposing effects on load depending on whether the initial condition is low or high recombination. Arrows indicate the region of the parameter space where an increase in recombination reduces genetic load. (c) The net effect of introducing sex-determining alleles. Sex-determining alleles reduce genetic load when drive is sufficiently strong or recombination is sufficiently weak.
References
-
- Bull JJ. 1983. Evolution of sex-determining mechanisms. Menlo Park, CA: Benjamin/Cummings.
-
- Charlesworth B. 2002. The evolution of chromosomal sex determination. In Genetics and biology of sex determination (eds Chadwick D, Goode J.), pp. 207–224. West Sussex, UK: John Wiley & Sons, Inc.
-
- Fisher RA. 1930. The genetical theory of natural selection. Oxford, UK: Clarendon Press.
Publication types
MeSH terms
LinkOut - more resources
Full Text Sources
Other Literature Sources
