. 2014 Nov 12;34(46):15244-59.
doi: 10.1523/JNEUROSCI.1918-14.2014.

Reversible behavioral phenotypes in a conditional mouse model of TDP-43 proteinopathies

Affiliations

Reversible behavioral phenotypes in a conditional mouse model of TDP-43 proteinopathies

Julio A Alfieri et al. J Neurosci. .

Abstract

Transactive response DNA-binding protein 43 (TDP-43) mislocalization and aggregation are hallmark features of amyotrophic lateral sclerosis and frontotemporal dementia (FTD). We have previously shown in mice that inducible overexpression of a cytoplasmically localized form of TDP-43 (TDP-43-ΔNLS) in forebrain neurons evokes neuropathological changes that recapitulate several features of TDP-43 proteinopathies. Detailed behavioral phenotyping could provide further validation for its usage as a model for FTD. In the present study, we performed a battery of behavioral tests to evaluate motor, cognitive, and social phenotypes in this model. We found that transgene (Tg) induction by doxycycline removal at weaning led to motor abnormalities including hyperlocomotion in the open field test, impaired coordination and balance in the rotarod test, and increased spasticity as shown by a clasping phenotype. Cognitive assessment demonstrated impaired recognition and spatial memory, measured by novel object recognition and Y-maze tests. Remarkably, TDP-43-ΔNLS mice displayed deficits in social behavior, mimicking a key aspect of FTD. To determine whether these symptoms were reversible, we suppressed Tg expression for 14 d in 1.5-month-old mice showing an established behavioral phenotype but modest neurodegeneration and found that motor and cognitive deficits were ameliorated; however, social performance remained altered. When Tg expression was suppressed in 6.5-month-old mice showing overt neurodegeneration, motor deficits were irreversible. These results indicate that TDP-43-ΔNLS mice display several core behavioral features of FTD with motor neuron disease, possibly due to functional changes in surviving neurons, and might serve as a valuable tool to unveil the underlying mechanisms of this and other TDP-43 proteinopathies.

Keywords: Behavioral phenotypes; TDP-43; frontotemporal dementia; neurodegeneration; proteinopathies; transgenic mice.


Figures

Figure 1.
Figure 1.
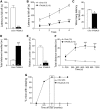
Progressive cortical and hippocampal atrophy in TDP-43-ΔNLS transgenic mice. A, Experimental design: transgene expression was activated at weaning (P28) by removing Dox from water, followed by analysis at the indicated time points. B, Body weight curve for non-TDP-43–expressing control (Ctrol) mice (nTg, tTA, ΔNLS) and bigenic mice (tTA/ΔNLS) assessed at different times off Dox (n = 10 per group). *p < 0.05; ***p < 0.001, two-way ANOVA/Bonferroni post hoc analysis. C, D, Cerebral cortex and hippocampus weights for Ctrol and tTA/ΔNLS mice at 1 and 6 months off Dox (n = 5 per group). *p < 0.05; **p < 0.01 significantly different from Ctrol group (Student's t test). The data are displayed as mean ± SEM. E, Visual perception. Percentage of animals stopping at the edge in the visual cliff test and reaction score (mean ± SEM) in the visual placing response. Bigenic mice did not show statistically significant impairments in visual performance (ns, nonsignificant Mann–Whitney U test; control, n = 12; tTA/ΔNLS, n = 8).
Figure 2.
Figure 2.
TDP-43-ΔNLS transgenic mice develop motor abnormalities. A, B, Rotarod performance. Bigenic mice demonstrated an impaired ability to remain on the rod compared with Ctrol mice. A, Fixed speed rotarod test (17 rpm). Mice were given 1 or 2 practice trials and then placed on the rotating cylinder; a 3 min cutoff per session was used (***p < 0.001 significantly different from Ctrol group, Student's t test). B, Accelerated rotarod test (4–40 rpm/5 min). Four trials per test were performed during the test day with a 2 min interval between trials. Latency to fall off the rotarod was recorded (*p < 0.05; ***p < 0.001, repeated measures two-way ANOVA/Bonferroni post hoc test). C, Hanging wire grip test. Grip strength was assessed using a standard wire cage turned upside down. The latency to fall off the wire lid was quantified. A 60 s cutoff time was used. *p < 0.05 significantly different from Ctrol group (Student's t test). DF, Exploratory and locomotor activity in a novel environment was assessed by a 20 min session in an open field chamber. TDP-43-ΔNLS Tg animals displayed severe hyperlocomotion. Bar graphs show the total distance traveled (D) and relative center distance (E) (***p < 0.001 significantly different from Ctrol group, Student's t test). F, Total distance traveled in time segments of 300 s (***p < 0.001, repeated-measures ANOVA/Bonferroni post hoc test). G, Percentage of mice with clasping phenotype at different times off Dox. Motor behavior in AF was analyzed at 1 month off Dox. Number of animals is indicated in parentheses or inside plot bars. Data represent mean ± SEM.
Figure 3.
Figure 3.
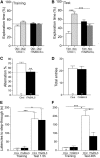
Cognitive deficits in TDP-43-ΔNLS transgenic mice. A, B, Novel object recognition test. A, Training day. Mice were exposed to two identical objects placed at opposite ends of the arena for 10 min and the time spent exploring each object was recorded. There was no difference in object exploration of the two objects in the training phase. B, Twenty-four hours later (test day), the mice were allowed to explore 1 copy of the previously presented object (familiar) and a new object (novel) for 5 min. The exploration time (%) represents the percentage of time that mice spend exploring the object (familiar or novel) respect to the total exploration time (familiar + novel). tTA/ΔNLS animals displayed no evidence of object recognition memory (***p < 0.001, one-way ANOVA/Newman–Keuls post hoc test). C, D, Y-maze spontaneous alternation task. Mice were placed at the end of one arm facing the center and allowed to explore the maze freely for 8 min without training, reward, or punishment. Entries into each arm were scored and alternation behavior was defined as a complete cycle of consecutive entrances into each of the 3 arms without repetition. C, tTA/ΔNLS mice alternated between the arms at the chance level (**p < 0.01 significantly different from Ctrol group Student's t test). D, Total entries were scored as an index of ambulatory activity in the Y maze. Cognitive behavior was analyzed at 1 month off Dox. E, F, Inhibitory avoidance task. During training, each mouse received a footshock as it stepped into the dark compartment (0.8 mA, 50 Hz, 1 s). Retention test was performed 1.5 h (short-term memory) or 48 h (long-term memory) later. The step-through latency was recorded; footshock was omitted during test session. E, Bigenic mice showed intact short-term memory compared with control littermates. F, TDP-43-ΔNLS mice had significantly lower step-through latencies 48 h after training, indicating a deficit in long-term memory. (*p < 0.05; ***p < 0.001 Kruskal–Wallis one-way ANOVA followed by individual Mann–Whitney U test). Number of animals is indicated in parentheses or inside plot bars. Data represent mean ± SEM.
Figure 4.
Figure 4.
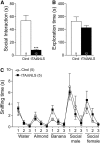
TDP-43-ΔNLS mice display abnormalities in social behavior. A, B, Social interaction test. A, Time spent sniffing the social (P21–P28 mouse) stimulus (social interaction) during a 10 min session. 1 month off Dox bigenic mice presented a reduced social interaction time during the session (***p < 0.001 significantly different from Ctrol group, Student's t test). B, No difference between groups was found in exploration time of the social chamber. C, Olfactory habituation/dishabituation test, 1 month off Dox. Swabs were dipped in tap water, almond extract (1:300), banana extract (1:300), and the bottom surface of a plastic cage that contained either a group of male or female mice. A 2 min odor presentation was used. There are no significant differences between groups (repeated-measures ANOVA/Bonferroni post hoc test). Number of animals is indicated in parentheses or inside plot bars. The data are displayed as mean ± SEM.
Figure 5.
Figure 5.
Assessment of motor, visual, social, and cognitive behavior in control and bigenic mice raised continuously on Dox until 1 month after weaning. A, Accelerated rotarod test. B, Hanging wire grip test. C, Limb-clasping motor phenotype and visual placing response test. DF, Exploratory and locomotor activity in the open field test. D, Total distance traveled in the open field chamber. E, Relative center distance during the open field session. F, Open field time bin analysis. G, H, Social interaction test. G, Time spent sniffing the social stimulus during a 10 min session. H, Exploration time of the social chamber. I, J, Y-maze alternation task. I, Percentage of spontaneous alternation during an 8 min session. J, Total entries scored. No differences between control and bigenic groups were found in the behavioral analysis (A and F: repeated-measures ANOVA, F(1,18) = 1.177, p = 0.3196 for group in A and F(1,21) = 0.2129, p = 0.6585 for group in F; B, D, E, GJ: p > 0.05, Student's t test; C: p > 0.05, Mann–Whitney test). Data represent mean ± SEM (Ctrol, n = 5; tTA/ΔNLS, n = 4).
Figure 6.
Figure 6.
TDP-43-ΔNLS suppression reverses motoric phenotypes in young transgenic mice. A, Experimental design. Mice raised on Dox until P28 were treated again with Dox at 0.5 months after weaning to suppress transgene expression during 2 weeks [1 mo(sup) mice] and analyzed 1 month after weaning. These mice were compared with mice in which transgene expression was maintained until 1 month after weaning (1mo mice, Ctrol and tTA/ΔNLS). B, Double immunofluorescence for total TDP-43 and hTDP-43 in coronal brain sections from 1mo (Ctrol and tTA/ΔNLS) and 1mo(sup) mice. Scale bar, 250 μm; inset, 20 μm. C, Immunoblot of total TDP-43 (h+mTDP-43) in cortical RIPA extracts. GAPDH was used as a loading control. D, Quantification of the immunoblot shown in C (***p < 0.001, one-way ANOVA/Newman–Keuls post hoc test, n = 4 per group). EK, Assessment of general motor behavior was performed in 0.5 mo, 1 mo, and 1 mo(sup) mice. E, Fixed speed rotarod test. F, G, Accelerated rotarod test. H, Total distance traveled in the open field chamber. I, Relative center distance during the open field session. J, Open field time bin analysis. K, Abnormal limb-clasping motor phenotype. 0.5 mo bigenic mice already displayed an altered motor behavior compared with Ctrol littermates (E, H, I, left; F). Remarkably, 1mo(sup) mice recover from motoric abnormalities (E, H, I, right; G, J, K). (E, H, I, left: ***p < 0.001 significantly different from Ctrol group, Student's t test; E, H, I, right: ***p < 0.001, one-way ANOVA/Newman–Keuls post hoc test; F,G **p = 0.007; ***p < 0.001 repeated-measures ANOVA/Bonferroni post hoc analysis; J: ***p < 0.001 significantly different from 1mo Ctrol and 1 mo(sup) (repeated measures ANOVA/Bonferroni post hoc analysis). K, 1mo tTA/ΔNLS differs significantly from 1mo Ctrol and 1mo(sup) tTA/ΔNLS (‡p < 0.001, Kruskal–Wallis one-way ANOVA/ Mann–Whitney U test). Number of animals is indicated in parentheses or inside plot bars. Data represent mean ± SEM.
Figure 7.
Figure 7.
Mild neurodegeneration in young TDP-43-ΔNLS transgenic mice. AC, Immunofluorescence staining for the neuronal marker NeuN in coronal brain sections (top) and thickness measurements (bottom) from DG granule cell layer (A), SSC (B), and MC (C) from 1 mo Ctrol, tTA/ΔNLS, and tTA/ΔNLS(sup) mice. DG thickness was significantly reduced in tTA/ΔNLS with respect to Ctrol mice. Scale bars: A, 50 μm; B and C, 250 μm. DF, Quantification of NeuN-positive cells in cortical regions (layer 5). SSC (D), MC (E), and PFC (F). 1 mo tTA/ΔNLS mice showed significant neuronal loss in the SSC, MC, and mPFC regions. Data are presented as total NeuN-positive cells per area (*p < 0.05; **p < 0.01; ***p < 0.001 one-way ANOVA/Newman–Keuls post hoc test). Data represent mean ± SEM (n = 8–10 per group).
Figure 8.
Figure 8.
Reversal of cognitive but not social abnormalities in young bigenic mice after suppression of TDP-43-ΔNLS expression. Assessment of cognitive and social behavior was performed in 0.5 mo, 1mo (Ctrol and tTA/ΔNLS), and 1 mo tTA/ΔNLS(sup) mice. A, B, Y-maze alternation task. A, Percentage of spontaneous alternation during an 8 min session. B, Total entries scored. C, D, Social interaction test. C, Time spent sniffing the social stimulus during a 10 min session. D, Exploration time of the social chamber. Cognitive and social interaction dysfunction was already detectable at 0.5 mo off Dox (A, C, left; **p < 0.01,***p < 0.001 significantly different from Ctrol group, Student's t test). hTDP-43-ΔNLS suppression was able to rescue cognitive abnormalities, but did not cause any improvement in social interaction (A, C, right; *p < 0.05; **p < 0.01; ***p < 0.001, one-way ANOVA/Newman–Keuls post hoc test). Number of animals is indicated inside plot bars. Data represent mean ± SEM.
Figure 9.
Figure 9.
Transgene suppression in older (6 months off Dox) mice does not reverse motor abnormalities. A, Experimental design. Mice raised on Dox until P28 were treated again with Dox at 5.5 months after weaning to suppress transgene expression during 2 weeks (6mo(sup) mice) and analyzed at 6 months after weaning. These mice were compared with mice in which transgene expression was maintained until 6 months after weaning (6mo mice, Ctrol, and tTA/ΔNLS). B, Double immunofluorescence for total TDP-43 (green) and hTDP-43 (red) in coronal brain sections from 6mo (Ctrol and tTA/ΔNLS) and 6mo(sup) mice. Scale bar, 250 μm; inset, 20 μm. C, Immunoblot of total TDP-43 (h+mTDP-43) in cortical RIPA extracts. GAPDH was used as a loading control. D, Quantification of the immunoblot shown in C (**p < 0.01, one-way ANOVA/Newman–Keuls post hoc test, n = 3 per group). EG, Motor behavior analysis was performed in 6mo and 6mo(sup) mice. E, Accelerated rotarod test. F, Percentage of mice with abnormal limb-clasping motor phenotype. G, Total distance traveled (left) and relative center distance (right) during an open field session. As expected, tTA/ΔNLS 6mo mice presented motor abnormalities in all the tests performed; however, hTDP-43-ΔNLS suppression was unable to rescue these behavioral abnormalities (E; **p = 0.001; ***p < 0.001 significantly different; ns, nonsignificant, p = 0.111, repeated-measures ANOVA/Bonferroni post hoc analysis; G; ***p < 0.001, one-way ANOVA/Newman–Keuls post hoc test; F, ‡p < 0.001 significantly different from 6mo Ctrol, Kruskal–Wallis one-way ANOVA followed by individual Mann–Whitney U test). Number of animals is indicated in parentheses or inside plot bars. Data represent mean ± SEM. HJ, Immunofluorescence staining for the neuronal marker NeuN in coronal brain sections (top) and thickness measurements (bottom) from SSC (H), MC (I), and DG (J) granule cell layer from 6mo (Ctrol and tTA/ΔNLS) and 6mo(sup) mice. *p < 0.05; **p < 0.01; ***p < 0.001, one-way ANOVA/Newman–Keuls post hoc test. Scale bars: H and I, 250 μm; J, 50 μm. Data represent mean ± SEM (n = 4 per group).

References

    1. Alami NH, Smith RB, Carrasco MA, Williams LA, Winborn CS, Han SS, Kiskinis E, Winborn B, Freibaum BD, Kanagaraj A, Clare AJ, Badders NM, Bilican B, Chaum E, Chandran S, Shaw CE, Eggan KC, Maniatis T, Taylor JP. Axonal transport of TDP-43 mRNA granules is impaired by ALS-causing mutations. Neuron. 2014;81:536–543. doi: 10.1016/j.neuron.2013.12.018. - DOI - PMC - PubMed
    1. Aviles-Reyes RX, Angelo MF, Villarreal A, Rios H, Lazarowski A, Ramos AJ. Intermittent hypoxia during sleep induces reactive gliosis and limited neuronal death in rats: implications for sleep apnea. J Neurochem. 2010;112:854–869. doi: 10.1111/j.1471-4159.2009.06535.x. - DOI - PubMed
    1. Báez-Mendoza R, Schultz W. The role of the striatum in social behavior. Front Neurosci. 2013;7:233. doi: 10.3389/fnins.2013.00233. - DOI - PMC - PubMed
    1. Belforte JE, Zsiros V, Sklar ER, Jiang Z, Yu G, Li Y, Quinlan EM, Nakazawa K. Postnatal NMDA receptor ablation in corticolimbic interneurons confers schizophrenia-like phenotypes. Nat Neurosci. 2010;13:76–83. doi: 10.1038/nn.2447. - DOI - PMC - PubMed
    1. Boccia MM, Acosta GB, Blake MG, Baratti CM. Memory consolidation and reconsolidation of an inhibitory avoidance response in mice: effects of i.c.v. injections of hemicholinium-3. Neuroscience. 2004;124:735–741. doi: 10.1016/j.neuroscience.2004.01.001. - DOI - PubMed

Publication types

MeSH terms

LinkOut - more resources