. 2014 Oct;61(10):1651-60.
doi: 10.1109/tuffc.2014.006360.

Statistical analysis of shear wave speed in the uterine cervix

Statistical analysis of shear wave speed in the uterine cervix

Lindsey C Carlson et al. IEEE Trans Ultrason Ferroelectr Freq Control. 2014 Oct.

Abstract

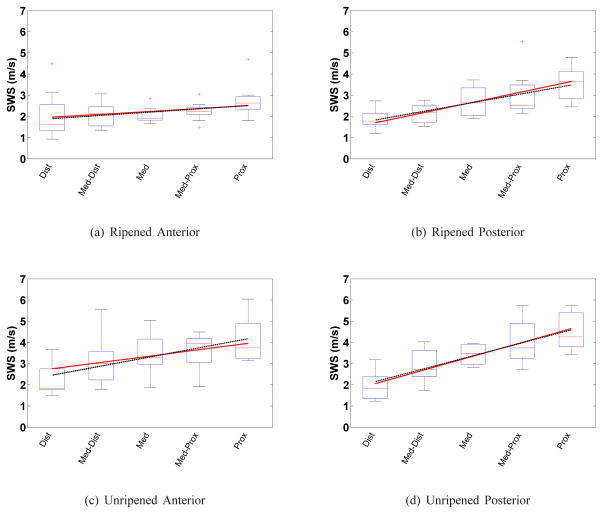
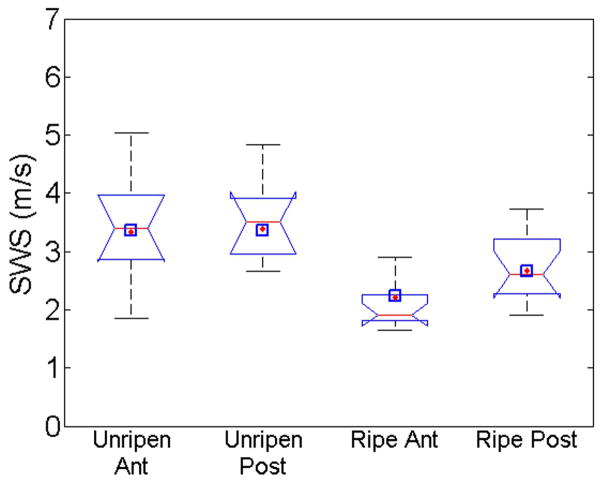
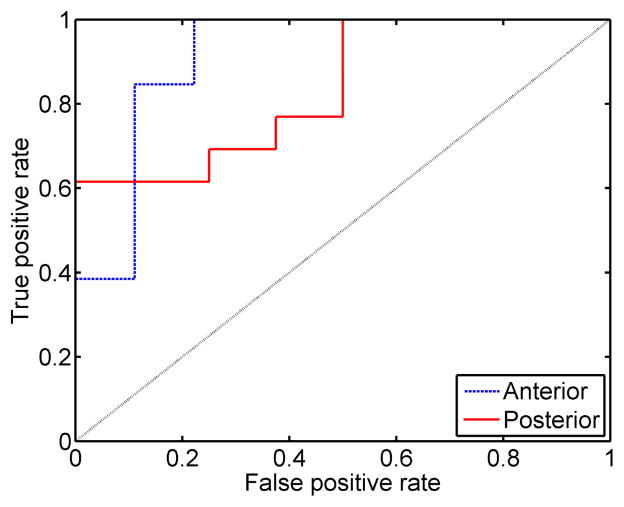
Although cervical softening is critical in pregnancy, there currently is no objective method for assessing the softness of the cervix. Shear wave speed (SWS) estimation is a noninvasive tool used to measure tissue mechanical properties such as stiffness. The goal of this study was to determine the spatial variability and assess the ability of SWS to classify ripened versus unripened tissue samples. Ex vivo human hysterectomy samples (n = 22) were collected; a subset (n = 13) were ripened. SWS estimates were made at 4 to 5 locations along the length of the canal on both anterior and posterior halves. A linear mixed model was used for a robust multivariate analysis. Receiver operating characteristic (ROC) analysis and the area under the ROC curve (AUC) were calculated to describe the utility of SWS to classify ripened versus unripened tissue samples. Results showed that all variables used in the linear mixed model were significant ( p < 0.05). Estimates at the mid location for the unripened group were 3.45 ± 0.95 m/s (anterior) and 3.56 ± 0.92 m/s (posterior), and 2.11 ± 0.45 m/s (anterior) and 2.68 ± 0.57 m/s (posterior) for the ripened ( p < 0.001). The AUCs were 0.91 and 0.84 for anterior and posterior, respectively, suggesting that SWS estimates may be useful for quantifying cervical softening.


Figures

Fig. 1
Fig. 1
A schematic diagram of the experimental setup. (Right) View of half a cervix from above. The dashed line indicates the endocervical canal and triangle is uterine cavity. (Left) View from the side of a cervix half. The transducer is aligned parallel to endocervical canal and focused mid-depth through the cervix indicated by lateral beam contours.
Fig. 2
Fig. 2
B-mode image of half of a bivalved cervix sample. The endocervical canal is located at the top, the distal end is on the left and proximal end/uterus is on the right. The bright line on the bottom is the SoAb rubber interface. The solid lines mark the distal end (external os) and the dashed lines the proximal end (internal os). These locations were verified by HF (the Maternal Fetal Medicine subspecialist co-author). Measurements were made between these endpoints.
Fig. 3
Fig. 3
Box plots of the mean SWS from each sample vs. cervical canal location for each group and cervix half for: ripened (a–b), and unripened (c–d); anterior (left column) and posterior (right column) slices. The boxes represent the interquartile range (IQR) among SWS estimates, the horizontal line near the middle of each box is the median value for that group, the whiskers represent the maxima and minima within 1.5*IQR, and crosses are outliers outside of 1.5*IQR. The solid line spanning the boxes is the mixed model fit based on equation 9. Similarly, the dashed line is the linear regression result for the mean SWS in that group. The linear regression does not take into account the repeated measures within the same specimen, whereas the mixed model does.
Fig. 4
Fig. 4
Boxplot of mean SWS at mid location for each group; Unripened Anterior, Unripened Posterior, Ripened Anterior, and Ripened Posterior respectively. The notches indicate 5% significance if two intervals do not overlap. The diamonds indicate the SWS predicted using the linear mixed model and squares are least squares predicted value.
Fig. 5
Fig. 5
Empirical receiver operating characteristic curves (ROC) for anterior (dashed) and posterior (solid) SWS mean SWS estimates at the mid location with a positive assigned to ripened tissue.
Fig. 6
Fig. 6
Mean SWS from the mid location for each unripened cervix half vs. thickness (radius of cervix).
Fig. 7
Fig. 7
Time-to-peak (TTP in ms) vs. lateral location for one SWS measurement. The sample TTP is shown as a solid line and was averaged over the full 5mm axial range. A simulated TTP for a constant SWS estimate of 1.91 m/s (dashed) and a simulated TTP for a constant increase in SWS of 0.99 m·s−1cm−1 (dotted).

References

    1. Read CP, Word RA, Ruscheinsky MA, Timmons BC, Mahendroo MS. Cervical remodeling during pregnancy and parturition: molecular characterization of the softening phase in mice. Reproduction. 2007 Aug;134(2):327–340. - PubMed
    1. Word RA, Li XH, Hnat M, Carrick K. Dynamics of cervical remodeling during pregnancy and parturition: Mechanisms and current concepts. Semin Reprod Med. 2007 Jan;25(1):69–79. - PubMed
    1. Akins ML, Luby-Phelps K, Mahendroo M. Second harmonic generation imaging as a potential tool for staging pregnancy and predicting preterm birth. J Biomed Opt. 2010 May;15(2):026020. - PMC - PubMed
    1. Hassan SS, Romero R, Vikyadhari D, Fusey S, Baxter J, Khandelwal M, Vijayaraghavan J, Trivedi Y, Soma-Pillay P, Sambarey P, Dayal A, Potapov V, O’Brien J, Astakhov V, Yuzko O, Kinzler W, Phillips JA, Creasy GW and for the PREGNANT Trial, . Vaginal progesterone reduces the rate of preterm birth in women with a sonographic short cervix: a multicenter, randomized, double-blind, placebo-controlled trial. Ultrasound Obstet Gynecol. 2011 Jul;38(1):18–31. - PMC - PubMed
    1. Parra-Saavedra M, Gmez L, Barrero A, Parra G, Vergara F, Navarro E. Prediction of preterm birth using the cervical consistency index. Ultrasound Obstet Gynecol. 2011 Jul;38(1):44–51. - PubMed

Publication types