

doi: 10.1371/journal.pgen.1004754.
eCollection 2014 Nov.
Regularized machine learning in the genetic prediction of complex traits
Affiliations
- PMID: 25393026
- PMCID: PMC4230844
- DOI: 10.1371/journal.pgen.1004754
Item in Clipboard
Regularized machine learning in the genetic prediction of complex traits
PLoS Genet.
.
No abstract available
Conflict of interest statement
The authors have declared that no competing interests exist.
Figures
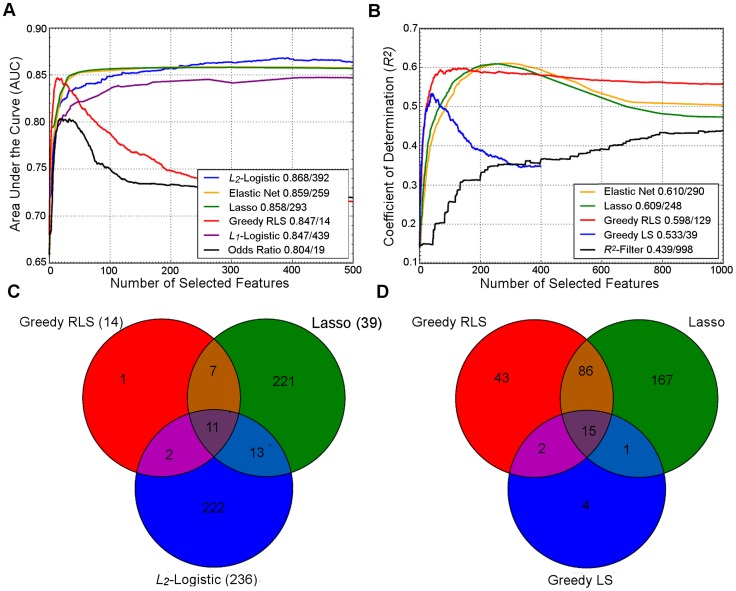
Upper panel: Behavior of the learning approaches in terms of their predictive accuracy (y-axis) as a function of the number of selected variants (x-axis). Differences can be attributed to the genotypic and phenotypic heterogeneity as well as genotyping density and quality. (A) The area under the receiver operating characteristic curve (AUC) for the prediction of Type 1 diabetes (T1D) cases in SNP data from WTCCC , representing ca. one million genetic features and ca. 5,000 individuals in a case-control setup. (B) Coefficient of determination (R
2) for the prediction of a continuous trait (Tunicamycin) in SNP data from a cross between two yeast strains (Y2C) , representing ca. 12,000 variants and ca. 1,000 segregants in a controlled laboratory setup. The peak prediction accuracy/number of most predictive variants are listed in the legend. The model validation was implemented using nested 3-fold cross-validation (CV) . Prior to any analysis being done, the data was split into three folds. On each outer round of CV, two of the folds were combined forming a training set, and the remaining one was used as an independent test set. On each round, all feature and parameter selection was done using a further internal 3-fold CV on the training set, and the predictive performance of the learned models was evaluated on the independent test set. The final performance estimates were calculated as the average over these three iterations of the experiment. In learning approaches where internal CV was not needed to select model parameters (e.g., log odds), this is equivalent to a standard 3-fold CV. T1D data: the L
2-regularized (ridge) regression was based on selecting the top 500 variants according to the χ
2 filter. For wrappers, we used our greedy L
2-regularized least squares (RLS) implementation , while the embedded methods, Lasso, Elastic Net and L
1-logistic regression, were implemented through the Scikit-Learn , interpolated across various regularization parameters up to the maximal number of variants (500 or 1,000). As a baseline model, we implemented a log odds-ratio weighted sum of the minor allele dosage in the 500 selected variants within each individual . Y2C: the filter method was based on the top 1,000 variants selected according to R
2, followed by L
2-regularization within greedy RLS using nested CV. As a baseline model, we implemented a greedy version of least squares (LS), which is similar to the stepwise forward regression used in the original work ; the greedy LS differs from the greedy RLS in terms that it implements regularization through optimization of L
0 norm instead of L
2. It was noted that the greedy LS method drops around the point where the number of selected variants exceeds the number training examples (here, 400). Lower panel: Overlap in the genetic features selected by the different approaches. (C) The numbers of selected variants within the major histocompatibility complex (MHC) are shown in parentheses for the T1D data. (D) The overlap among then maximally predictive variants in the Y2C data. Note: these results should be considered merely as illustrative examples. Differing results may be obtained when other prediction models are implemented in other genetic datasets or other prediction applications.
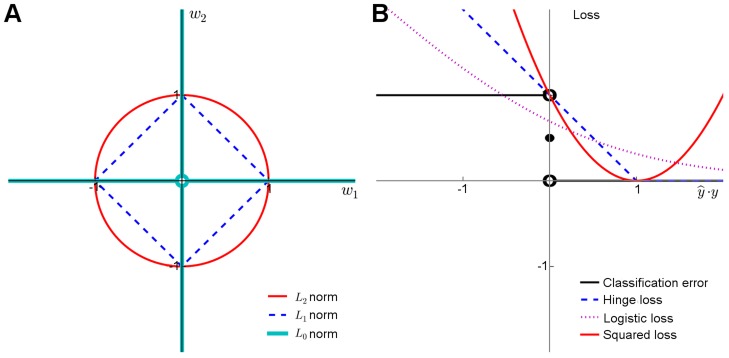
(A) Penalty terms: L
0-norm imposes the most explicit constraint on the model complexity as it effectively counts the number of nonzero entries in the model parameter vector. While it is possible to train prediction models with L
0-penalty using, e.g., greedy or other types of discrete optimization methods, the problem becomes mathematically challenging due to the nonconvexity of the constraint, especially when other than the squared loss function is used. The convexity of the L
1 and L
2 norms makes them easier for the optimization. While the L
2 norm has good regularization properties, it must be used together with either L
0 or L
1 norms to perform feature selection. (B) Loss functions: The plain classification error is difficult to minimize due to its nonconvex and discontinuous nature, and therefore one often resorts to its better behaving surrogates, including the hinge loss used with SVMs, the cross-entropy used with logistic regression, or the squared error used with regularized least-squares classification and regression. These surrogates in turn differ both in their quality of approximating the classification error and in terms of the optimization machinery they can be minimized with (Text S1).
References
-
- Okser S, Pahikkala T, Aittokallio T (2013) Genetic variants and their interactions in disease risk prediction - machine learning and network perspectives. BioData Min 6: 5 doi:10.1186/1756-0381-6-5 - DOI - PMC - PubMed
Publication types
MeSH terms
Grants and funding
LinkOut - more resources
Full Text Sources
Other Literature Sources
