

Systematic Review of Prevalence of Young Child Overweight and Obesity in the United States-Affiliated Pacific Region Compared With the 48 Contiguous States: The Children's Healthy Living Program
- PMID: 25393168
- PMCID: PMC4265894
- DOI: 10.2105/AJPH.2014.302283
Systematic Review of Prevalence of Young Child Overweight and Obesity in the United States-Affiliated Pacific Region Compared With the 48 Contiguous States: The Children's Healthy Living Program
Abstract
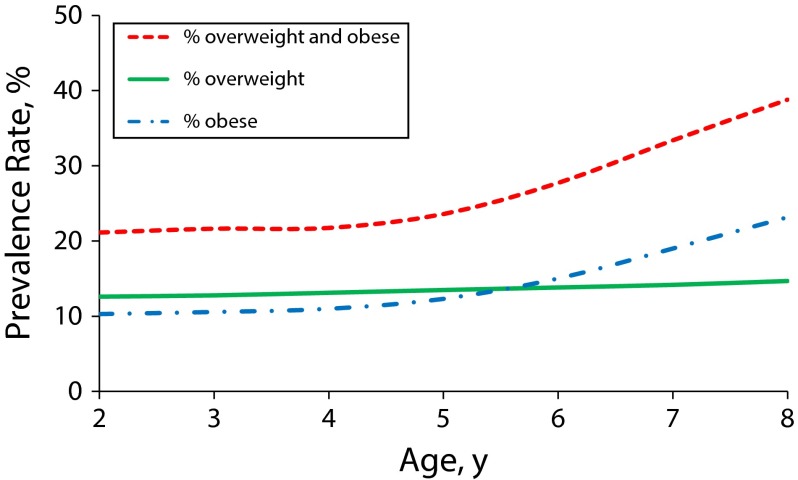
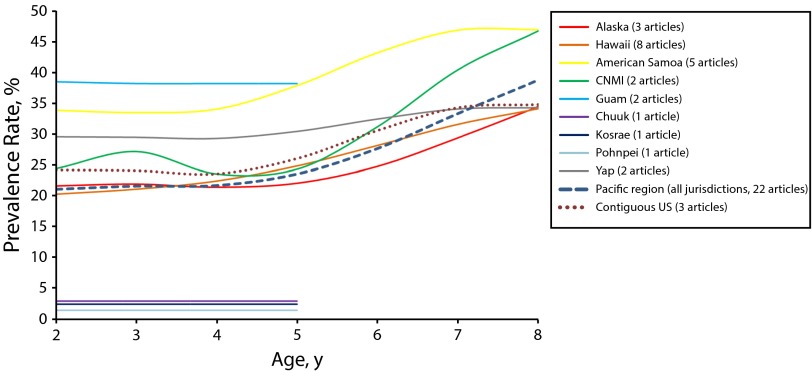
We estimated overweight and obesity (OWOB) prevalence of children in US-Affiliated Pacific jurisdictions (USAP) of the Children's Healthy Living Program compared with the contiguous United States. We searched peer-reviewed literature and government reports (January 2001-April 2014) for OWOB prevalence of children aged 2 to 8 years in the USAP and found 24 sources. We used 3 articles from National Health and Nutrition Examination Surveys for comparison. Mixed models regressed OWOB prevalence on an age polynomial to compare trends (n = 246 data points). In the USAP, OWOB prevalence estimates increased with age, from 21% at age 2 years to 39% at age 8 years, increasing markedly at age 5 years; the proportion obese increased from 10% at age 2 years to 23% at age 8 years. The highest prevalence was in American Samoa and Guam.
Figures
References
-
- Murphy SP. Collection and analysis of intake data from the integrated survey. J Nutr. 2003;133(2):585S–589S. - PubMed
-
- Peterkin BB. Nationwide food consumption survey, 1977–1978. Prog Clin Biol Res. 1981;67:59–69. - PubMed
-
- Centers for Disease Control and Prevention, National Center for Health Statistics. National Health and Nutrition Examination Survey: note on 2007–2010 sampling methodology. 2011. Available at: http://www.cdc.gov/nchs/nhanes/nhanes2007-2008/sampling_0708.htm. Accessed April 12, 2013.
-
- Hixson L, Hepler BB, Kim MO. The Native Hawaiian and Other Pacific Islander Population: 2010. Washington, DC: US Census Bureau; 2012.
-
- Department of Labor and Workforce Development. Alaska 2010 census demographic profiles. 2010. Available at: http://live.laborstats.alaska.gov/cen/dp.cfm. Accessed January 5, 2014.
Grants and funding
LinkOut - more resources
Full Text Sources
Medical
Miscellaneous
