

Functional diversity of carbohydrate-active enzymes enabling a bacterium to ferment plant biomass
- PMID: 25393313
- PMCID: PMC4230839
- DOI: 10.1371/journal.pgen.1004773
Functional diversity of carbohydrate-active enzymes enabling a bacterium to ferment plant biomass
Abstract
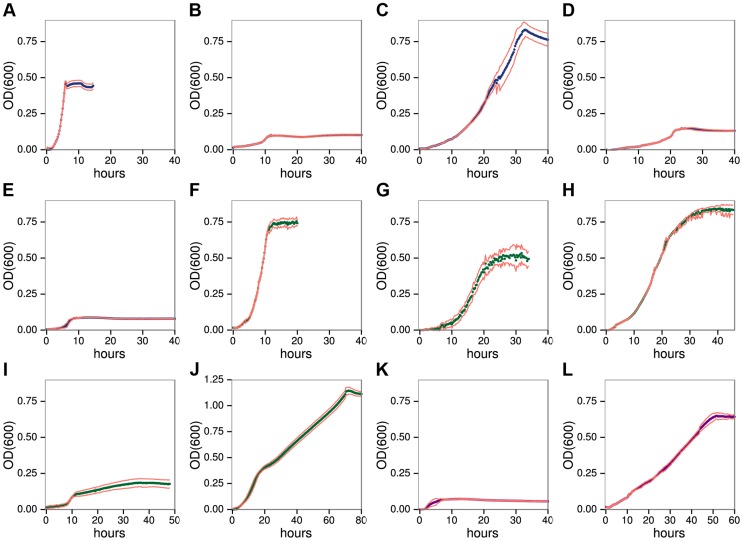
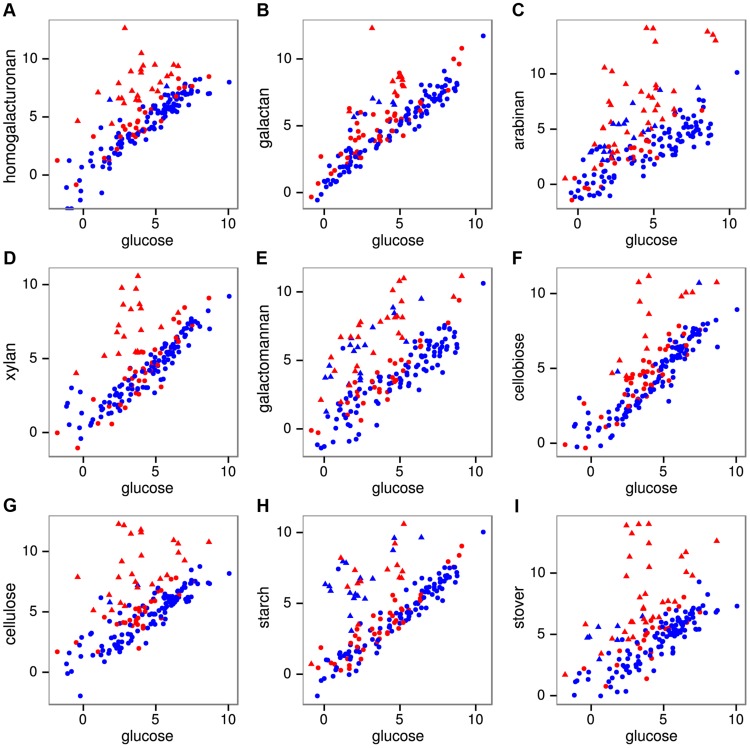
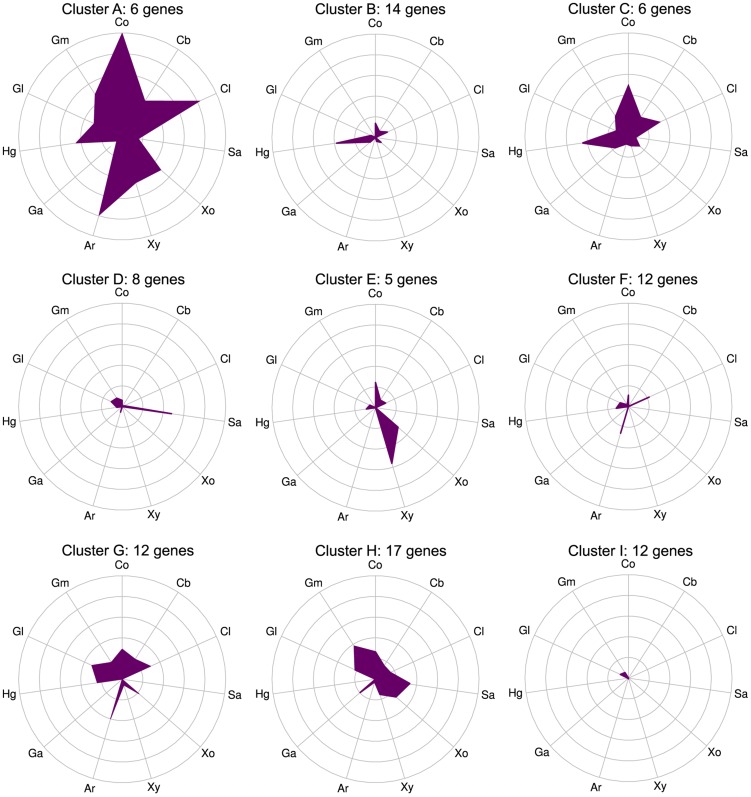
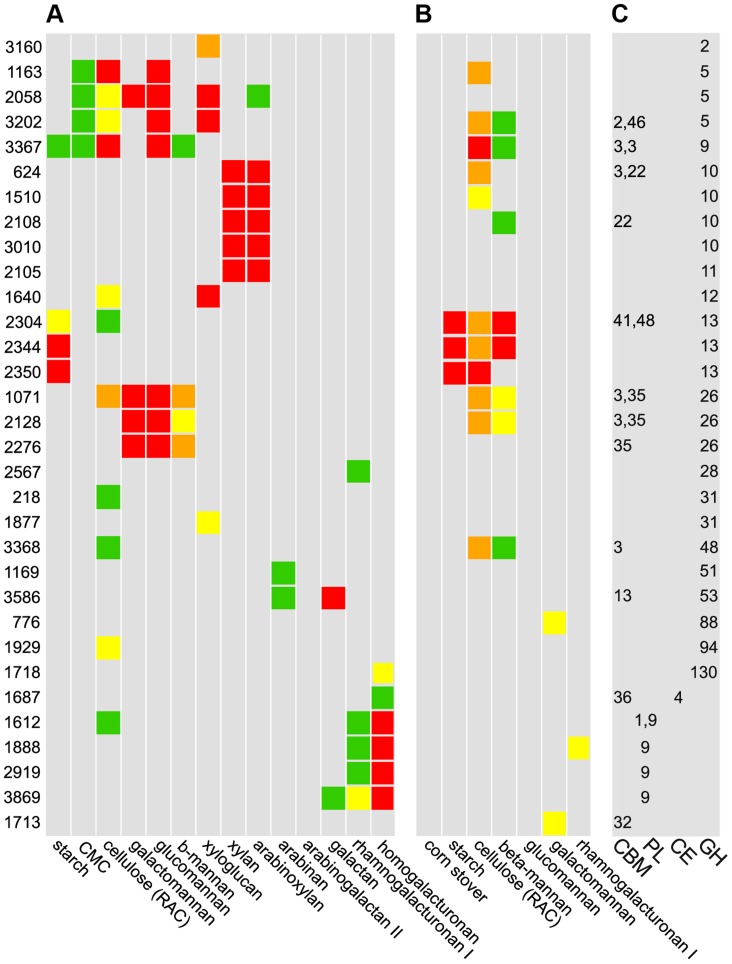
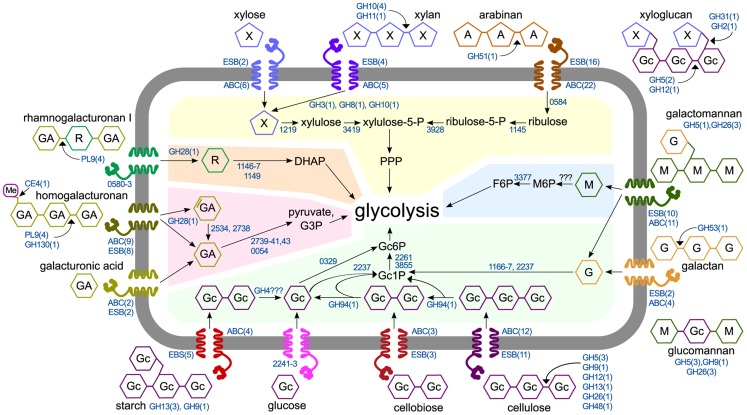
Microbial metabolism of plant polysaccharides is an important part of environmental carbon cycling, human nutrition, and industrial processes based on cellulosic bioconversion. Here we demonstrate a broadly applicable method to analyze how microbes catabolize plant polysaccharides that integrates carbohydrate-active enzyme (CAZyme) assays, RNA sequencing (RNA-seq), and anaerobic growth screening. We apply this method to study how the bacterium Clostridium phytofermentans ferments plant biomass components including glucans, mannans, xylans, galactans, pectins, and arabinans. These polysaccharides are fermented with variable efficiencies, and diauxies prioritize metabolism of preferred substrates. Strand-specific RNA-seq reveals how this bacterium responds to polysaccharides by up-regulating specific groups of CAZymes, transporters, and enzymes to metabolize the constituent sugars. Fifty-six up-regulated CAZymes were purified, and their activities show most polysaccharides are degraded by multiple enzymes, often from the same family, but with divergent rates, specificities, and cellular localizations. CAZymes were then tested in combination to identify synergies between enzymes acting on the same substrate with different catalytic mechanisms. We discuss how these results advance our understanding of how microbes degrade and metabolize plant biomass.
Conflict of interest statement
The authors have declared that no competing interests exist.
Figures

Similar articles
-
Transcriptomic and proteomic analyses of core metabolism in Clostridium termitidis CT1112 during growth on α-cellulose, xylan, cellobiose and xylose.BMC Microbiol. 2016 May 23;16:91. doi: 10.1186/s12866-016-0711-x. BMC Microbiol. 2016. PMID: 27215540 Free PMC article.
-
Evolution of a Biomass-Fermenting Bacterium To Resist Lignin Phenolics.Appl Environ Microbiol. 2017 May 17;83(11):e00289-17. doi: 10.1128/AEM.00289-17. Print 2017 Jun 1. Appl Environ Microbiol. 2017. PMID: 28363966 Free PMC article.
-
Population level analysis of evolved mutations underlying improvements in plant hemicellulose and cellulose fermentation by Clostridium phytofermentans.PLoS One. 2014 Jan 22;9(1):e86731. doi: 10.1371/journal.pone.0086731. eCollection 2014. PLoS One. 2014. PMID: 24466216 Free PMC article.
-
Enzymatic degradation of cell wall and related plant polysaccharides.Crit Rev Biotechnol. 1989;8(4):237-74. doi: 10.3109/07388558909148194. Crit Rev Biotechnol. 1989. PMID: 2650883 Review.
-
Plant cell walls to ethanol.Biochem J. 2012 Mar 1;442(2):241-52. doi: 10.1042/BJ20111922. Biochem J. 2012. PMID: 22329798 Review.
Cited by
-
Combining free and aggregated cellulolytic systems in the cellulosome-producing bacterium Ruminiclostridium cellulolyticum.Biotechnol Biofuels. 2015 Aug 13;8:114. doi: 10.1186/s13068-015-0301-4. eCollection 2015. Biotechnol Biofuels. 2015. PMID: 26269713 Free PMC article.
-
The Effect of Type 2 Resistant Starch and Indole-3-Propionic Acid on Ameliorating High-Fat-Diet-Induced Hepatic Steatosis and Gut Dysbiosis.Foods. 2024 May 23;13(11):1625. doi: 10.3390/foods13111625. Foods. 2024. PMID: 38890854 Free PMC article.
-
Bacterial community structure in the rumen and hindgut is associated with nitrogen efficiency in Holstein cows.Sci Rep. 2023 Jul 3;13(1):10721. doi: 10.1038/s41598-023-37891-7. Sci Rep. 2023. PMID: 37400555 Free PMC article.
-
Global repositioning of transcription start sites in a plant-fermenting bacterium.Nat Commun. 2016 Dec 16;7:13783. doi: 10.1038/ncomms13783. Nat Commun. 2016. PMID: 27982035 Free PMC article.
-
Gut Microbiota in Lactose Intolerance: A Mendelian Randomization Study on Microbial Mechanisms and Potential Links to Tumor Inflammatory Microenvironments.Mediators Inflamm. 2025 Jun 5;2025:8181816. doi: 10.1155/mi/8181816. eCollection 2025. Mediators Inflamm. 2025. PMID: 40510587 Free PMC article.
References
-
- McNeil NI (1984) The contribution of the large intestine to energy supplies in man. Am J Clin Nutr 39: 338–342. - PubMed
Publication types
MeSH terms
Substances
LinkOut - more resources
Full Text Sources
Other Literature Sources
