. 2015 Feb;23(2):278-89.
doi: 10.1038/mt.2014.222. Epub 2014 Nov 13.

Cyclooxygenase-2 silencing for the treatment of colitis: a combined in vivo strategy based on RNA interference and engineered Escherichia coli

Affiliations

Cyclooxygenase-2 silencing for the treatment of colitis: a combined in vivo strategy based on RNA interference and engineered Escherichia coli

Enzo Spisni et al. Mol Ther. 2015 Feb.

Abstract

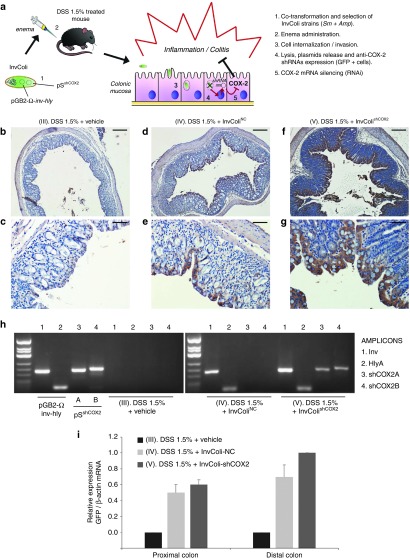
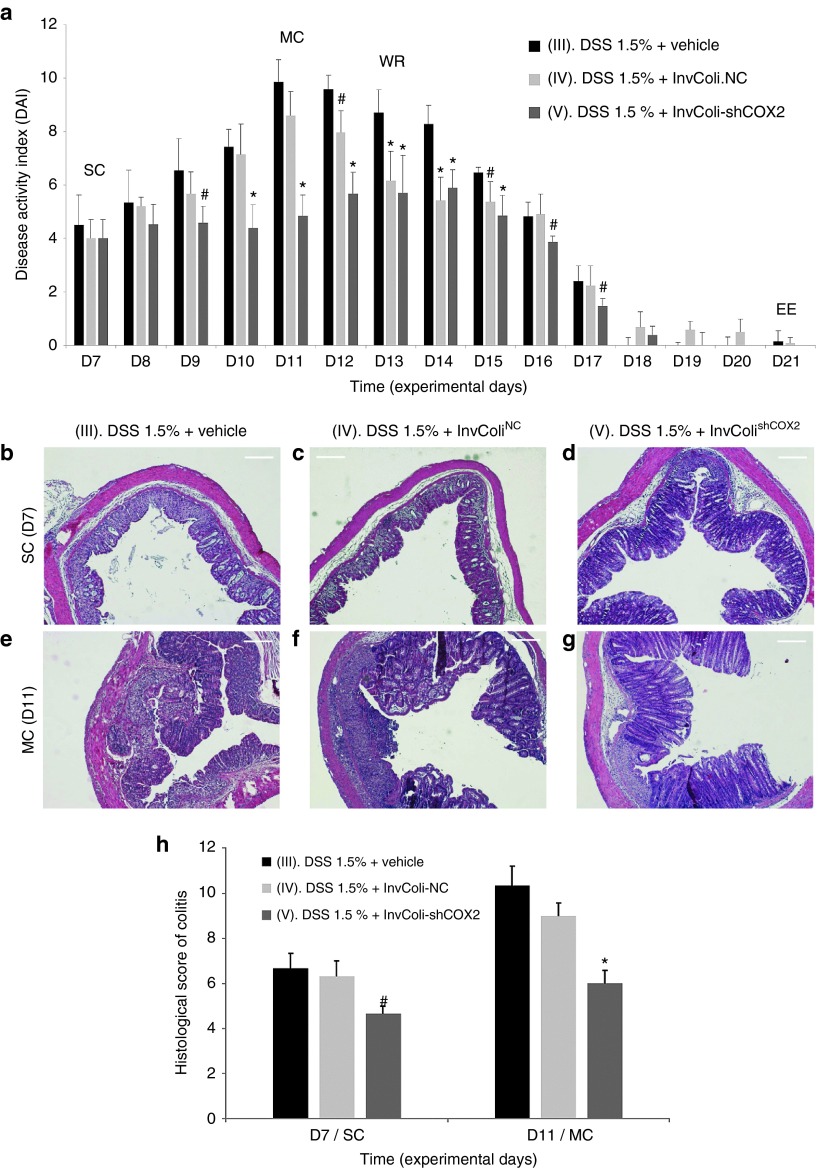
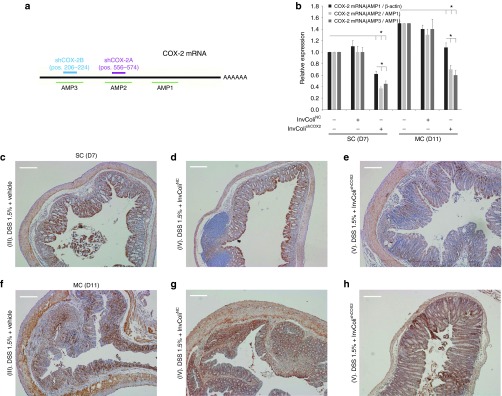
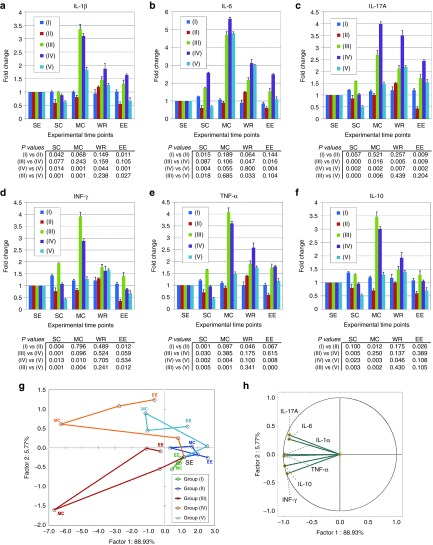
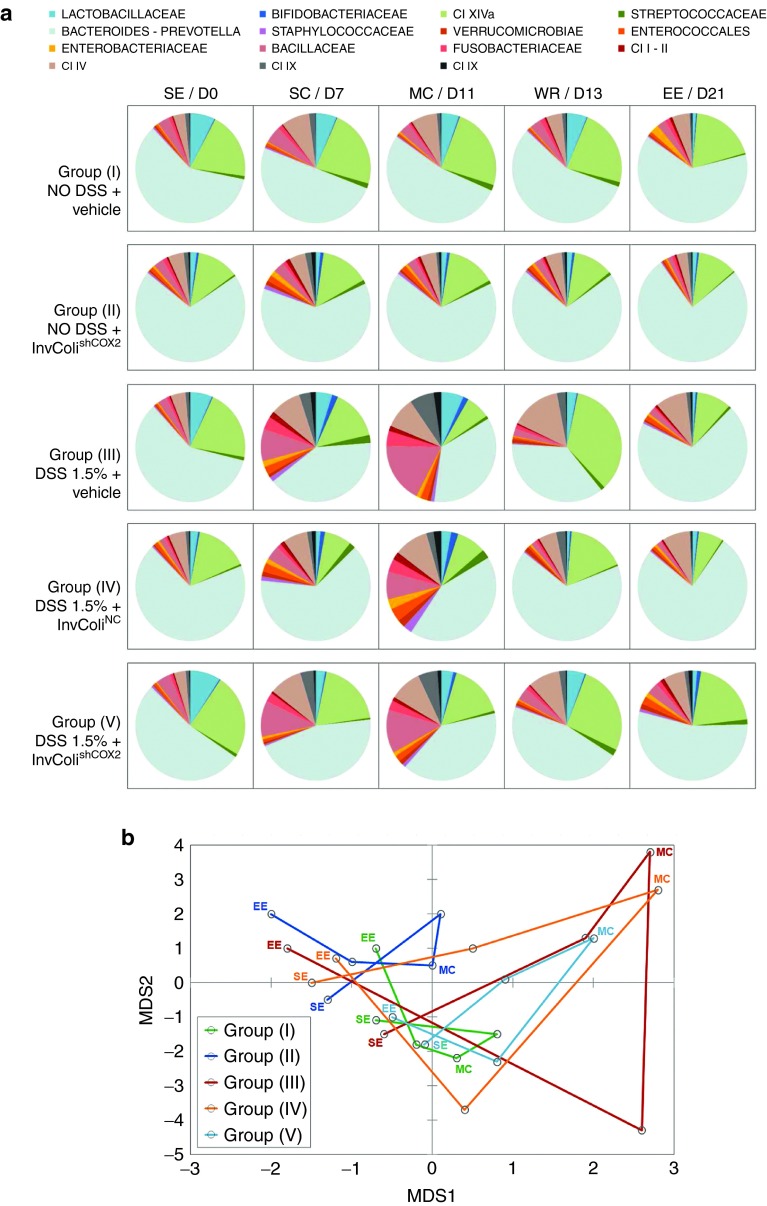
Nonpathogenic-invasive Escherichia coli (InvColi) bacteria are suitable for genetic transfer into mammalian cells and may act as a vehicle for RNA Interference (RNAi) in vivo. Cyclooxygenase-2 (COX-2) is overexpressed in ulcerative colitis (UC) and Crohn's disease (CD), two inflammatory conditions of the colon and small intestine grouped as inflammatory bowel disease (IBD). We engineered InvColi strains for anti-COX-2 RNAi (InvColi(shCOX2)), aiming to investigate the in vivo feasibility of a novel COX-2 silencing strategy in a murine model of colitis induced by dextran sulfate sodium (DSS). Enema administrations of InvColi(shCOX2) in DSS-treated mice led to COX-2 downregulation, colonic mucosa preservation, reduced colitis disease activity index (DAI) and increased mice survival. Moreover, DSS/InvColi(shCOX2)-treated mice showed lower levels of circulating pro-inflammatory cytokines and a reduced colitis-associated shift of gut microbiota. Considering its effectiveness and safety, we propose our InvColi(shCOX2) strategy as a promising tool for molecular therapy in intestinal inflammatory diseases.


Figures

Figure 1
Figure 1
InvColishCOX2 strategy is suitable for genetic material transfer in vivo. (a) E. coli (DH5α) is cotransformed with pGB2-Ω-inv-hly and pSshCOX2 plasmids to obtain the InvColishCOX2 strain, subsequently selected and administered via enema to colitic mice treated with DSS 1.5%. InvColishCOX2 bacteria penetrate colon epithelial cells and promote after endocytic lysis the expression of two short hairpin RNA (shRNA) targeting COX-2 mRNA. (bg) GFP protein expression was evaluated by immunohistochemistry in FFPE colon specimens from experimental mice group III (DSS 1.5% + vehicle), IV (DSS 1.5% + InvColiNC), and V (DSS 1.5% + InvColishCOX2). Colon specimens were collected on day 7 (D7, start colitis, SC). (b,d,f) Scale bar = 200 µm; magnification ×50. (c,e,g) Scale bar = 50 µm; magnification ×200. Vehicle = LB medium. (h) PCR analysis of Inv-(1), HlyA-(2), shCOX2A-(3), and shCOX2B-(4) amplicons was performed on pGB2-Ω-inv-hly, pSshCOX2A/B purified plasmids and on total DNA extracted from group III, IV, and V (colon specimens). PCR products were analyzed after electrophoresis on 2.5% agarose gel. (i) GFP mRNA expression was analyzed by real-time PCR and normalized against β-actin mRNA levels. Relative expression was calculated referring to group V (distal colon, time D7) and data represent the mean + SEM of three independent analyses (n = 3 per group).
Figure 2
Figure 2
Effect of the InvColishCOX2 strategy on DSS-induced colitis. (a) The biological effect of InvColi/RNAi-mediated COX-2 silencing was evaluated considering the disease activity index (DAI) of colitis, calculated by the combined score of weight loss, stool consistency, and bleeding (see also Supplementary Figures S2b and S4). All parameters were scored from experimental day 7 (D7) to experimental day 21 (D21). Experimental mice groups: (III) “DSS 1.5% + vehicle”; (IV) “DSS 1.5% + InvColiNC”; (V) “DSS 1.5% + InvColishCOX2.” Vehicle, LB medium; EE, end of experiment; MC, maximum colitis; SC, start colitis; WR, weight recovery. Data represent the mean + SD of independent measurements; per group: n = 12 (D7), n = 9 (D8–D11), n = 6 (D12–D13), n = 3 (D14–D21). *P < 0.01; #P < 0.05. (b,g) A histological analysis was carried out on FFPE colon specimens from group III, IV, and V. Colon specimens were collected on day 7 (D7, start colitis, SC) and day 11 (D11, maximum colitis, MC). Scale bar = 200 µm; magnification ×50. (h) Quantification of histological differences between experimental mice group III, IV, and V at times D7 and D11, based on the scoring parameters shown in Supplementary Figure S2c. Data represent the mean + SEM of independent measurements (n = 3 per group). *P < 0.01. #P < 0.05.
Figure 3
Figure 3
InvColishCOX2 treatment induces COX-2 silencing in murine colon mucosa. (a) Two different sequences of short hairpin RNA (shRNA) were tested for murine COX-2 mRNA silencing and three different amplicons were considered to evaluate COX-2 mRNA levels (b) COX-2 expression was analyzed in fresh colon samples from mice, immediately processed after sacrifice. Total COX-2 mRNA expression (AMP1) was normalized against β-actin mRNA expression whereas AMP2 and AMP3 levels were normalized against AMP1 level. Relative expression was calculated referring to the negative control (DSS-treated/InvColi-untreated mice, time D7) and data represent the mean + SEM of three independent analyses (n = 3 per group). *P < 0.01. (ch) COX-2 protein expression was evaluated by immunohistochemistry in FFPE colon specimens from experimental mice group III (DSS 1.5% + vehicle), IV (DSS 1.5% + InvColiNC), and V (DSS 1.5% + InvColishCOX2). For IHC analysis, colon specimens were collected on day 7 (D7, start colitis, SC) and day 11 (D11, maximum colitis, MC). Scale bar = 200 µm; magnification ×50.
Figure 4
Figure 4
InvColishCOX2 treatment exerts anti-inflammatory effects in colitic mice. (a–f) The inflammatory cytokine profile was evaluated in plasma samples from all experimental mice groups (IV). Blood samples were collected at five different time points: SE (start of experiment, D0), SC (start of colitis, D7), MC (maximum of colitis, D11), WR (weight recovery, D13), and EE (end of experiment, D21). IL-1β, IL-6, IL-17A, IFN-γ, TNF-α, and IL-10 expression analysis was performed using a Luminex-based multiplexed bead immunoassay. Cytokine concentration values (pg/ml, data not shown) were calculated considering the dilution factor of plasma samples and variations in graphs are expressed as fold change, from the basal level of each cytokine at time D0. Data represent the mean + SD of independent measurements; per group: n = 12 (D0 and D7), n = 9 (D11), n = 6 (D13), n = 3 (D21). Statistical significance (P values) for differences between mice groups is included in the figure below each graph (group I versus II, group III versus IV, group IV versus V, and group III versus V). (g,h) Principal component analysis (PCA) was performed on the entire cytokine dataset considering the appropriate variables (cytokines; n = 6) and total cases (five experimental groups at five different time points; n = 25). The relations among variables and cases were highlighted by plotting them in the space generated by the factor axes 1 and 2. Green: “NO DSS + vehicle” (group I); blue: “NO DSS + InvColishCOX2” (group II); red: “DSS 1.5% + vehicle” (group III); orange: “DSS 1.5% + InvColiNC” (group IV); cyan: “DSS 1.5% + InvColishCOX2 (group V). Consecutive time points are connected by the line.
Figure 5
Figure 5
InvColishCOX2 impairs colitis-associated intestinal microbiota modifications. (a) The relative abundance profile of mice fecal microbiota components is reported for all five experimental mice groups (IV) at the following time points: SE/D0 (start of experiment), SC/D7 (start of colitis), MC/D11 (maximum of colitis), WR/D13 (weight recovery), and EE/D21 (end of experiment, D21). The microbiota was characterized using the fully validated phylogenetic DNA microarray platform HTF-Microbi.Array. (b) The principal coordinate analysis (PCoA) of the Euclidean distances between the fecal microbiota of each mice groups at five different time points is shown. Green: “NO DSS + vehicle” (group I); blue: “NO DSS + InvColishCOX2” (group II); red: “DSS 1.5% + vehicle” (group III); orange: “DSS 1.5% + InvColiNC” (group IV); cyan: “DSS 1.5% + InvColishCOX2 (group V). Consecutive time points are connected by the line. MDS1 and MDS2 = multidimensional scaling 1 and 2.

References

    1. Grillot-Courvalin C, Goussard S, Huetz F, Ojcius DM, Courvalin P. Functional gene transfer from intracellular bacteria to mammalian cells. Nat Biotechnol. 1998;16:862–866. - PubMed
    1. Castagliuolo I, Beggiao E, Brun P, Barzon L, Goussard S, Manganelli R.et al. (2005Engineered E. coli delivers therapeutic genes to the colonic mucosa Gene Ther 121070–1078. - PubMed
    1. Critchley-Thorne RJ, Stagg AJ, Vassaux G. Recombinant Escherichia coli expressing invasin targets the Peyer's patches: the basis for a bacterial formulation for oral vaccination. Mol Ther. 2006;14:183–191. - PubMed
    1. Xiang S, Fruehauf J, Li CJ. Short hairpin RNA-expressing bacteria elicit RNA interference in mammals. Nat Biotechnol. 2006;24:697–702. - PubMed
    1. Spisni E, Tomasi V. Bicknell R, Lewis CE, Ferrara N. Tumour Angiogenesis. Oxford University Press; Oxford; 1997. Involvement of prostanoid in angiogenesis; pp. pp. 291–300.

Publication types

MeSH terms