. 2014 Nov 13;5(11):e1524.
doi: 10.1038/cddis.2014.477.

Docosahexaenoic acid induces the degradation of HPV E6/E7 oncoproteins by activating the ubiquitin-proteasome system

Affiliations

Docosahexaenoic acid induces the degradation of HPV E6/E7 oncoproteins by activating the ubiquitin-proteasome system

K Jing et al. Cell Death Dis. .

Abstract

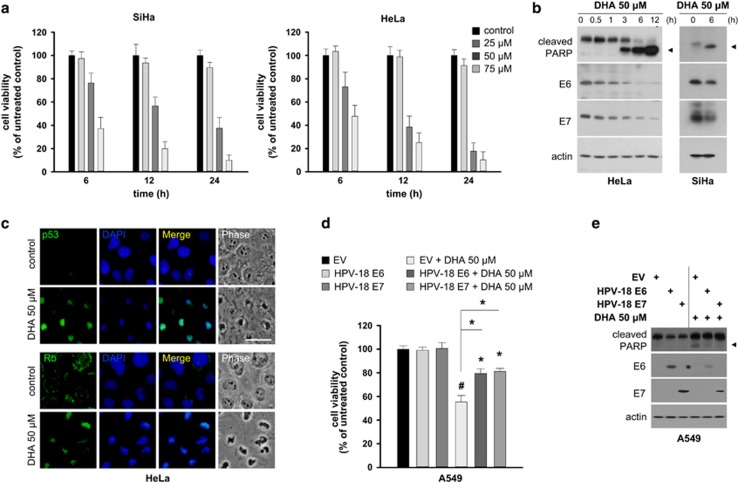
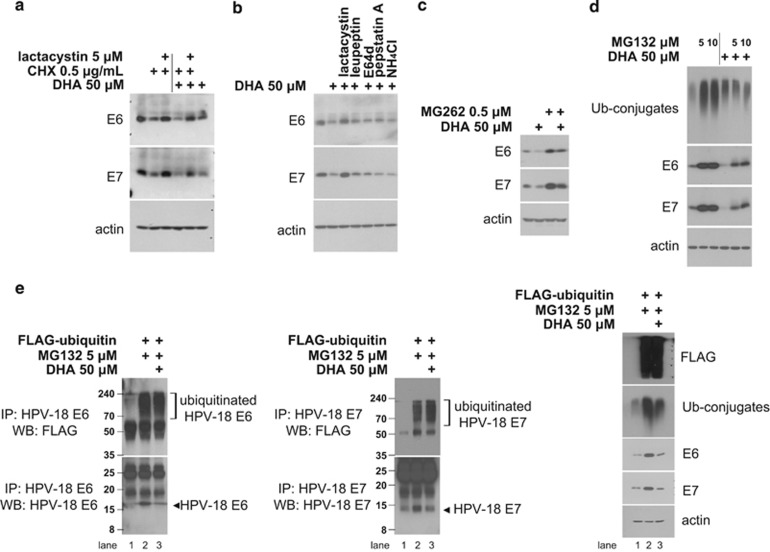
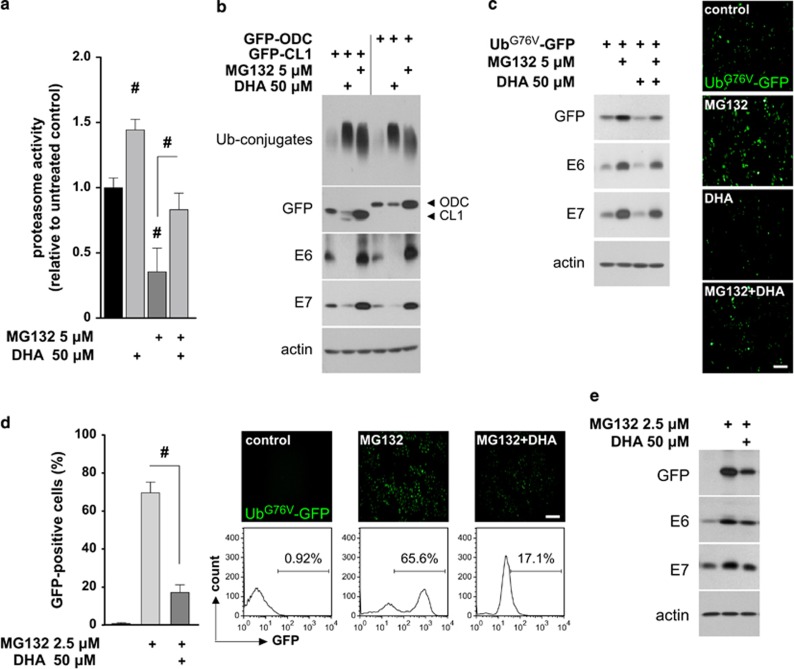
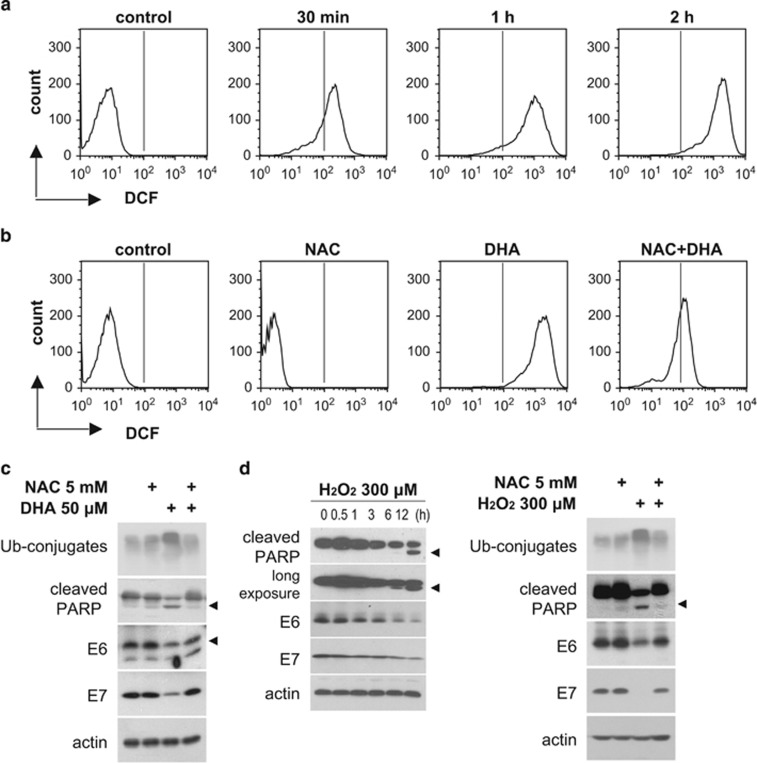
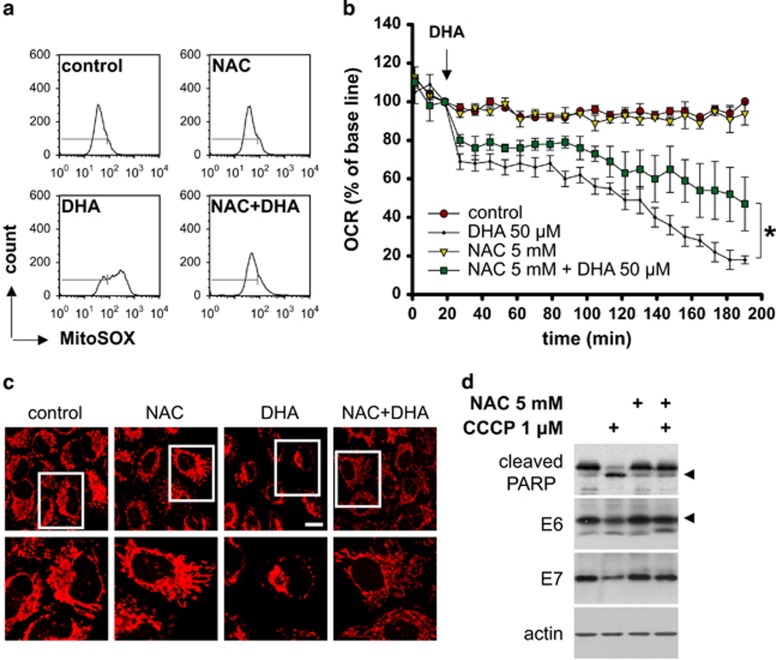
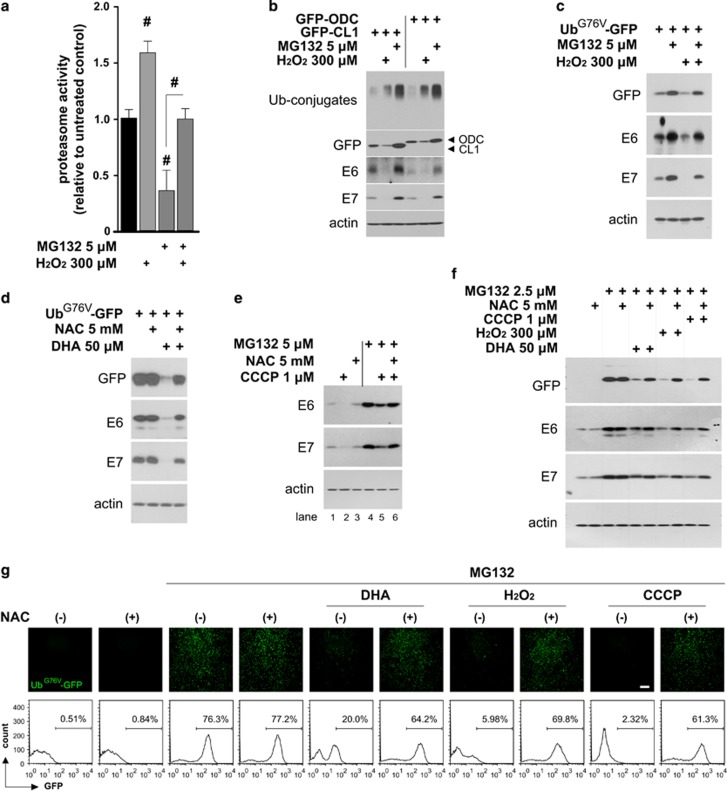
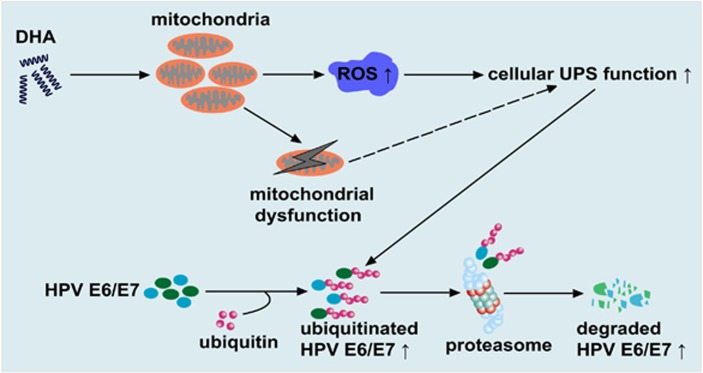
The oncogenic human papillomavirus (HPV) E6/E7 proteins are essential for the onset and maintenance of HPV-associated malignancies. Here, we report that activation of the cellular ubiquitin-proteasome system (UPS) by the omega-3 fatty acid, docosahexaenoic acid (DHA), leads to proteasome-mediated degradation of E6/E7 viral proteins and the induction of apoptosis in HPV-infected cancer cells. The increases in UPS activity and degradation of E6/E7 oncoproteins were associated with DHA-induced overproduction of mitochondrial reactive oxygen species (ROS). Exogenous oxidative stress and pharmacological induction of mitochondrial ROS showed effects similar to those of DHA, and inhibition of ROS production abolished UPS activation, E6/E7 viral protein destabilization, and apoptosis. These findings identify a novel role for DHA in the regulation of UPS and viral proteins, and provide evidence for the use of DHA as a mechanistically unique anticancer agent for the chemoprevention and treatment of HPV-associated tumors.


Figures

Figure 1
Figure 1
DHA-induced E6/E7 repression is associated with apoptosis in oncogenic HPV-infected cancer cells. (a) SiHa (left) and HeLa (right) cells were incubated with increasing concentrations (0, 25, 50 and 75 μM) of DHA for 6, 12 and 24 h, and cell viability was measured by MTT assays. (b) HeLa (left) and SiHa (right) cells were incubated with 50 μM DHA for the indicated times, and the expression levels of PARP and E6/E7 were assessed by western blotting. (c) Phase-contrast and merged images of HeLa cells treated with vehicle or 50 μM DHA for 6 h and stained for p53 (top) and Rb (bottom) (green). Nuclei were stained with DAPI (scale bar, 10 μm). (d and e) A549 cells seeded on 96-well plates or 10-cm dishes were transiently transfected with a control empty vector (EV) or with HPV-18 E6/E7 expression vectors. At 36 h post transfection, the cells were treated, or not, with 50 μM DHA for 6 h and then subjected to MTT assays (d) or western blotting (e). Results are represented as mean±S.D. values. Error bars indicate S.D. (n=3). *P<0.05; #P<0.001
Figure 2
Figure 2
DHA induces the UPS-dependent degradation of E6/E7 viral oncoproteins. (a) HeLa cultures were pretreated, or not, with lactacystin (5 μM) for 1 h before the addition of CHX (0.5 μg/ml), DHA (50 μM) or a combination of the two. Cells were collected 6 h later and subjected to western blot analysis. (b) HeLa cells were left untreated or treated with 50 μM DHA for 6 h with 1 h of pretreatment of 5 μM lactacystin, 10 μM leupeptin, 2.5 μg/ml E64d, 1 μM pepstatin A and 10 mM NH4Cl, respectively. Whole-cell lysates were extracted and blotted with antibodies against E6/E7. (c) HeLa cells were preincubated with or without 0.5 μM MG262 for 1 h before the addition of 50 μM DHA. After 6 h, whole-cell lysates were blotted with anti-E6/E7 antibodies. (d) HeLa cells were pretreated, or not, with 5 μM or 10 μM MG132 for 1 h and then treated with 50 μM DHA for 6 h. The expression levels of indicated proteins were then examined by western blotting (WB). (e) DHA increases E6/E7 ubiquitination. HeLa cells transiently expressing a control vector or FLAG-ubiquitin plasmid were pretreated, or not, with 5 μM MG132 for 1 h and then treated with 50 μM DHA for 6 h. Whole-cell lysates were subjected to immunoprecipitation (IP) with anti-E6 (left) or -E7 (middle) antibodies, as indicated, followed by WB with anti-FLAG (top) or anti-E6/E7 (bottom) antibodies. Right, whole-cell lysates were blotted with anti-FLAG, -ubiquitin (Ub-conjugates) and -E6/E7 antibodies to examine expression levels
Figure 3
Figure 3
DHA promotes the degradation of E6/E7 viral proteins by increasing UPS activity. (a) HeLa cells were left untreated or pretreated with 5 μM MG132 for 1 h, and then exposed to 50 μM DHA for 6 h. Total cell extracts (10 μg) were prepared and incubated with fluorogenic peptide Suc-LLVY-aminomethylcoumarin for 1 h, and the fluorescence signal was measured. The untreated control was set to 1. (b) HeLa cells transiently transfected with the indicated reporters were incubated with 50 μM DHA or 5 μM MG132 for 6 h, and the expression of the reporters, E6/E7, and ubiquitinated conjugates (Ub-conjugates) was examined by western blotting. (c) HeLa cells transiently transfected with the UbG76V-GFP reporter were pretreated, or not, with 5 μM MG132 for 1 h and then treated with 50 μM DHA for 6 h. Left, expression levels of the reporters and E6/E7 were analyzed by western blotting; right, fluorescence micrographs of UbG76V-GFP reporter expression following different treatments (as described in the left panel). Scale bar, 100 μm. (d and e) DHA increases the degradation of the UbG76V-GFP reporter and the E6/E7 proteins. UbG76V-GFP HeLa cells were either left untreated or preincubated with 2.5 μM MG132 for 4 h to induce the accumulation of the reporter. The cells were then treated, or not, with 50 μM DHA for 6 h. Cells were collected and GFP fluorescence was examined by flow cytometry (d). The bar graph shows the results of four independent experiments. Fluorescence images and histograms show a representative experiment (scale bar, 100 μm). Alternatively, the cells were subjected to immunoblotting (e). Data are represented as mean±S.D. values, and error bars indicate S.D. (n⩾3). #P<0.001
Figure 4
Figure 4
The DHA-induced reduction in E6/E7 expression is dependent on ROS accumulation. (a) HeLa cells were treated with 50 μM DHA for the indicated times, and intracellular ROS levels were detected by flow cytometry using CM-H2DCFDA probes. (b) CM-H2DCFDA-loaded HeLa cells were pretreated, or not, with 5 mM NAC for 1 h followed by 50 μM DHA for 2 h, and ROS levels were examined by flow cytometry. (c) HeLa cells were pretreated, or not, for 1 h with 5 mM NAC followed by 50 μM DHA for 6 h. Whole-cell lysates were blotted with the indicated antibodies. (d) HeLa cells were incubated with 300 μM H2O2 for the indicated times (left), or pretreated, or not, for 1 h with 5 mM NAC followed by incubation with 300 μM H2O2 for 6 h (right). Whole-cell lysates were extracted, and blotted with the indicated antibodies
Figure 5
Figure 5
Involvement of mitochondrial ROS in the downregulation of E6/E7. (a) HeLa cells were pretreated, or not, for 1 h with 5 mM NAC followed by 50 μM DHA for 2 h, and mitochondrial ROS levels were examined by flow cytometry using MitoSOX Red probes (Molecular Probes). (b) The oxygen consumption rate (OCR) of HeLa cells treated with 5 mM NAC, 50 μM DHA, or NAC plus DHA was measured using a Seahorse Bioscience XF Analyzer. The arrow indicates the time of DHA addition. (c) Representative confocal microscopic images of HeLa cells stained with a vital mitochondrial dye (MitoTracker Red) after incubation with NAC, DHA, or NAC plus DHA. Cells were preincubated with 5 mM NAC for 1 h, and then treated with or without 50 μM DHA for another 2 h. The bottom panel indicates higher power views of the boxed area in the top panel (scale bar, 10 μm). (d) HeLa cells were preincubated with 5 mM NAC for 1 h, and then treated with or without 1 μM CCCP for another 6 h. The protein levels of E6/E7 and PARP were analyzed by western blotting. Mean±S.D. values are shown, and error bars indicate S.D. (n=3). *P<0.05
Figure 6
Figure 6
ROS are responsible for the increase in UPS activity and the subsequent degradation of E6/E7. (a) HeLa cells were left untreated or pretreated with 5 μM MG132 for 1 h, and then exposed to 300 μM H2O2 for 6 h. The relative proteasome activity in cell extracts containing 10 μg of proteins was measured. The untreated control was set to 1. (b) HeLa cells transiently transfected with the indicated reporters were incubated with 300 μM H2O2 or 5 μM MG132 for 6 h, and the levels of the reporters, E6/E7, and Ub-conjugates were examined by western blotting. (c) HeLa cells transiently expressing the UbG76V-GFP reporter were pretreated, or not, for 1 h with 5 μM MG132 and then incubated with 300 μM H2O2 for 6 h. GFP and E6/E7 expression levels were then examined by western blotting. (d) HeLa cells transiently expressing the UbG76V-GFP reporter were pretreated, or not, for 1 h with 5 mM NAC and then incubated with 50 μM DHA for 6 h. GFP and E6/E7 expression levels were then examined by western blotting. (e) HeLa cells were preincubated with or without 5 μM MG132 for 1 h and then exposed to NAC (5 mM), CCCP (1 μM), or a combination of both, for 6 h. Where indicated, NAC was added 1 h before CCCP treatment, and the expression levels of E6/E7 were analyzed by western blotting. (f and g) UbG76V-GFP HeLa cells were left untreated or preincubated with 2.5 μM MG132 for 4 h, and then treated with NAC (5 mM), DHA (50 μM), H2O2 (300 μM), CCCP (1 μM), or a combination of NAC and DHA/H2O2/CCCP for 6 h. Where indicated, NAC was added to the medium 1 h before treatment with DHA, H2O2, or CCCP. (f) Cells were collected and subjected to immunoblotting with the indicated antibodies. (g) GFP expression was photographed under a fluorescent microscope (top) and then examined by flow cytometry (bottom). Scale bar, 200 μm. Data are represented as mean±S.D. values, and error bars indicate S.D. (n⩾3). #P<0.001
Figure 7
Figure 7
Proposed model showing how DHA reduces the expression of the E6/E7 viral oncoproteins in oncogenic HPV-infected cancer cells. DHA stimulates cellular ROS accumulation primarily via inducing mitochondrial ROS overproduction, which leads to mitochondria failure and the activation of cellular UPS. As a result, the UPS-dependent degradation of E6/E7 viral proteins is accelerated. Note that mitochondrial dysfunction might contribute to the UPS activation induced by DHA (dashed line)

Similar articles

Cited by

References

    1. Zandberg DP, Bhargava R, Badin S, Cullen KJ. The role of human papillomavirus in nongenital cancers. CA Cancer J Clin. 2013;63:57–81. - PubMed
    1. Wentzensen N, Vinokurova S, von Knebel Doeberitz M. Systematic review of genomic integration sites of human papillomavirus genomes in epithelial dysplasia and invasive cancer of the female lower genital tract. Cancer Res. 2004;64:3878–3884. - PubMed
    1. Moody CA, Laimins LA. Human papillomavirus oncoproteins: pathways to transformation. Nat Rev Cancer. 2010;10:550–560. - PubMed
    1. McLaughlin-Drubin ME, Meyers J, Munger K. Cancer associated human papillomaviruses. Curr Opin Virol. 2012;2:459–466. - PMC - PubMed
    1. Yugawa T, Kiyono T. Molecular mechanisms of cervical carcinogenesis by high-risk human papillomaviruses: novel functions of E6 and E7 oncoproteins. Rev Med Virol. 2009;19:97–113. - PubMed

Publication types

MeSH terms

Substances