. 2014 Nov 13;10(11):e1004785.
doi: 10.1371/journal.pgen.1004785. eCollection 2014 Nov.

Evolution of DNA methylation patterns in the Brassicaceae is driven by differences in genome organization

Affiliations

Evolution of DNA methylation patterns in the Brassicaceae is driven by differences in genome organization

Danelle K Seymour et al. PLoS Genet. .

Abstract

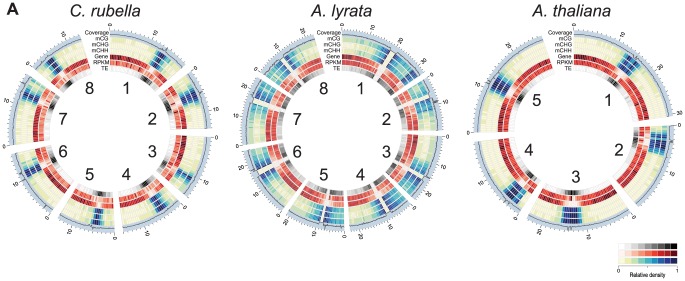
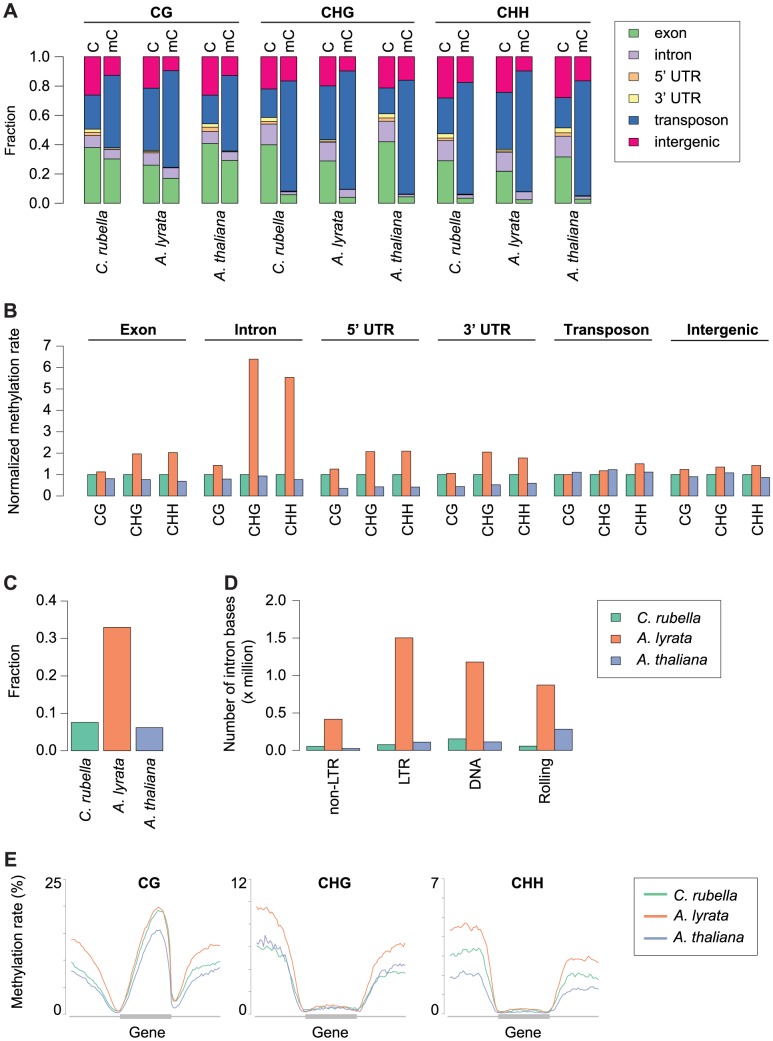
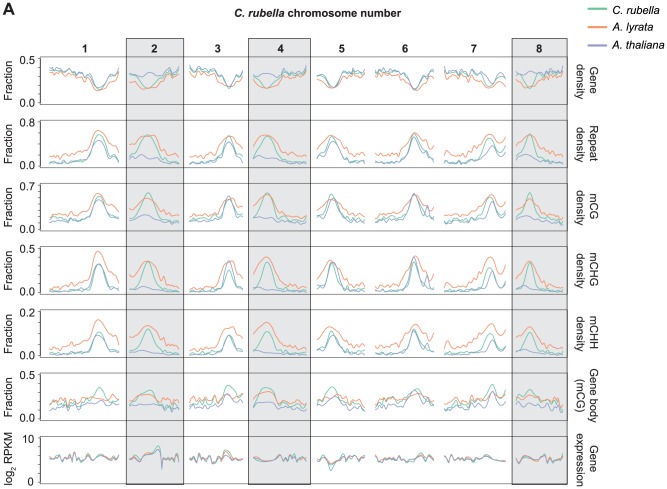
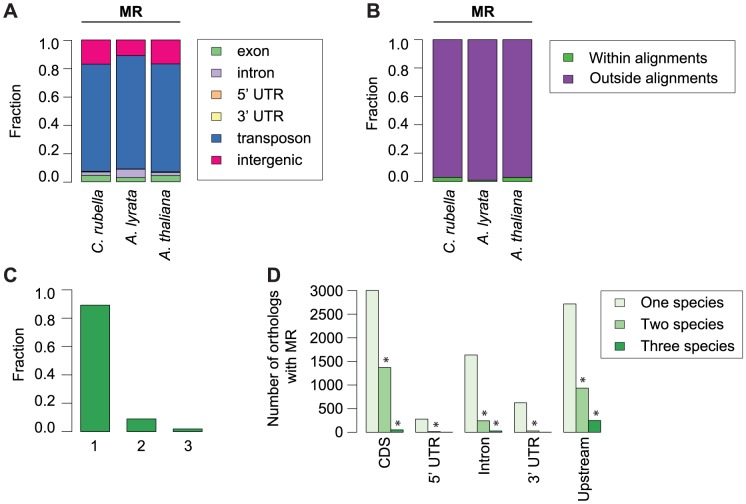
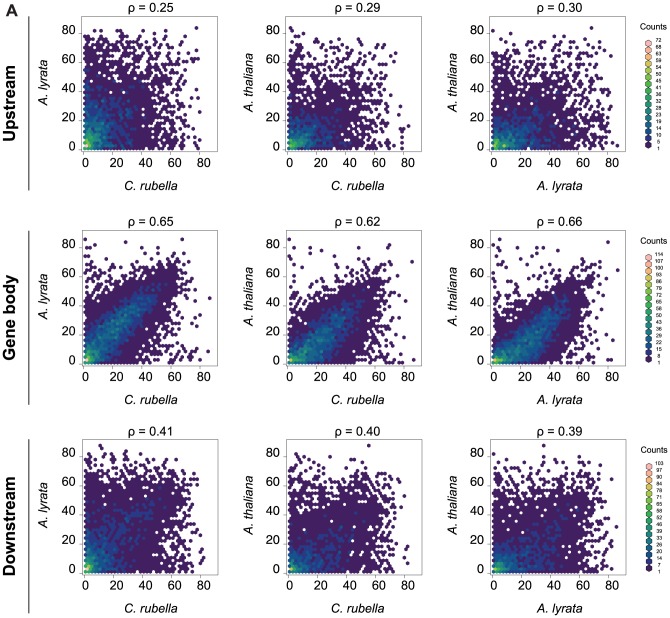
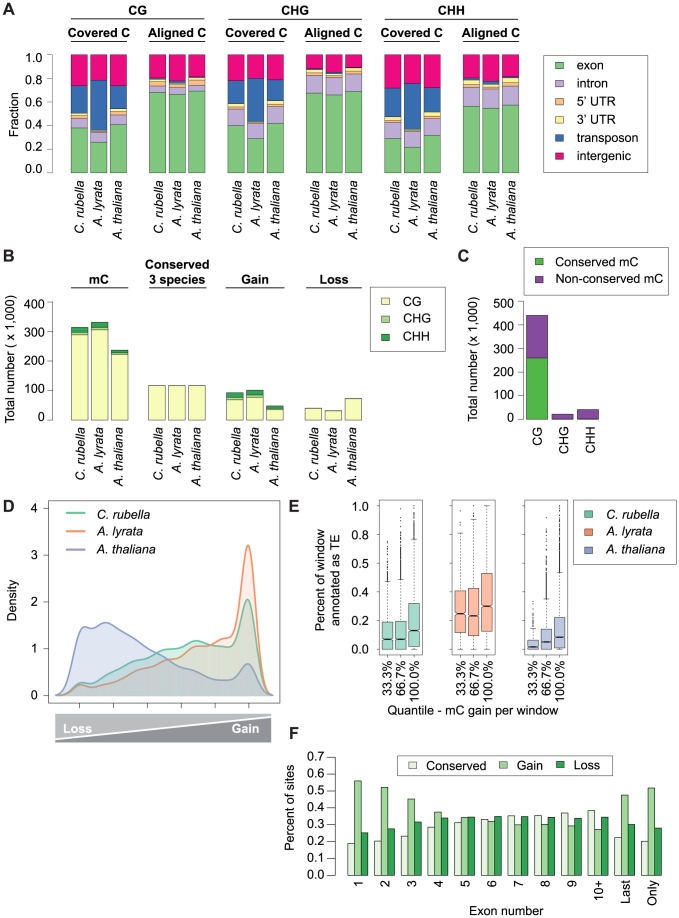
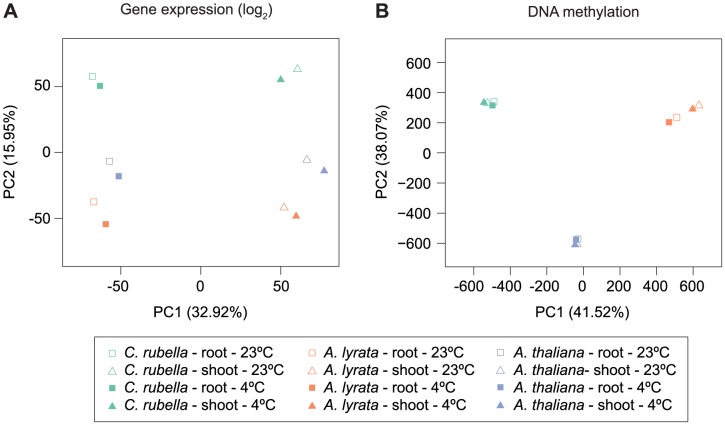
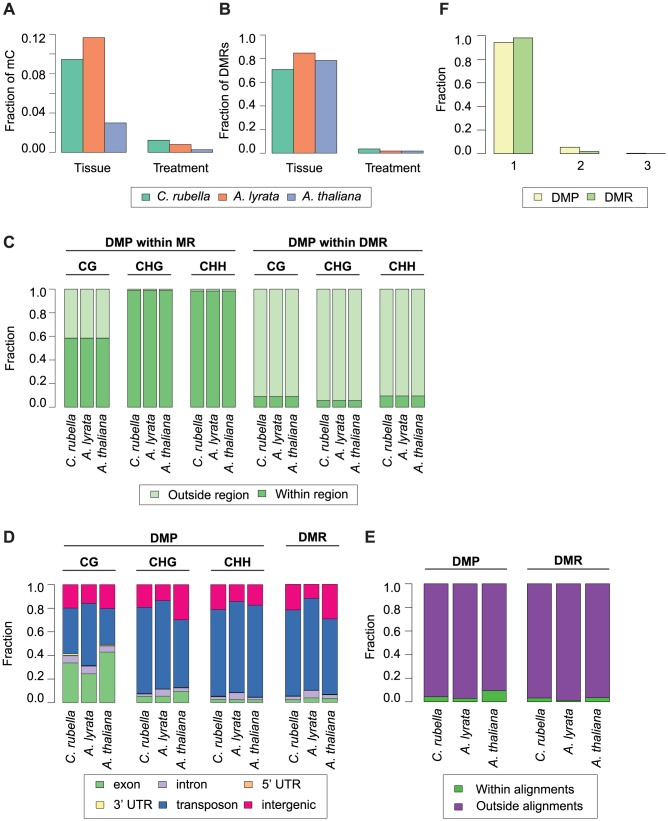
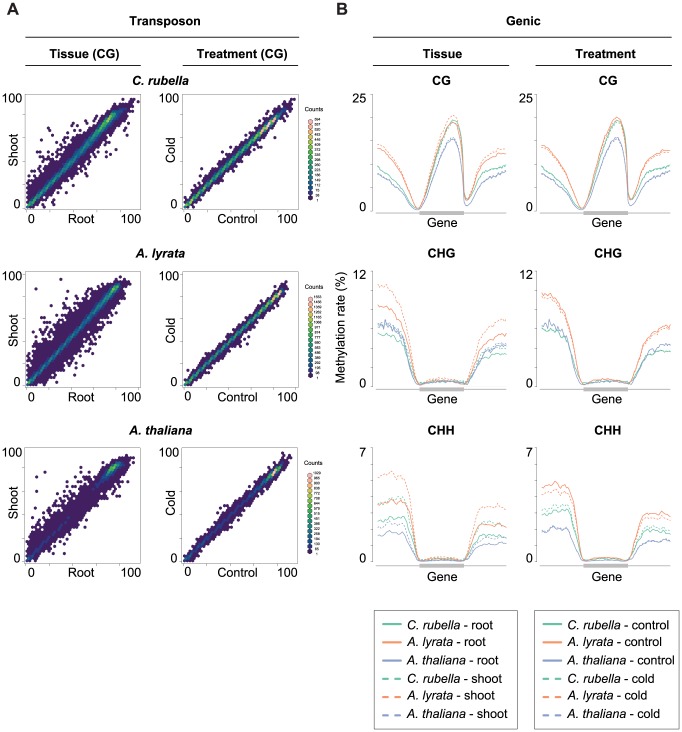
DNA methylation is an ancient molecular modification found in most eukaryotes. In plants, DNA methylation is not only critical for transcriptionally silencing transposons, but can also affect phenotype by altering expression of protein coding genes. The extent of its contribution to phenotypic diversity over evolutionary time is, however, unclear, because of limited stability of epialleles that are not linked to DNA mutations. To dissect the relative contribution of DNA methylation to transposon surveillance and host gene regulation, we leveraged information from three species in the Brassicaceae that vary in genome architecture, Capsella rubella, Arabidopsis lyrata, and Arabidopsis thaliana. We found that the lineage-specific expansion and contraction of transposon and repeat sequences is the main driver of interspecific differences in DNA methylation. The most heavily methylated portions of the genome are thus not conserved at the sequence level. Outside of repeat-associated methylation, there is a surprising degree of conservation in methylation at single nucleotides located in gene bodies. Finally, dynamic DNA methylation is affected more by tissue type than by environmental differences in all species, but these responses are not conserved. The majority of DNA methylation variation between species resides in hypervariable genomic regions, and thus, in the context of macroevolution, is of limited phenotypic consequence.


Conflict of interest statement

The authors have declared that no competing interests exist.

Figures

Figure 1
Figure 1. Genomic distribution of DNA methylation.
A) Circos plots of C. rubella, A. lyrata, and A. thaliana. Chromosome number is indicated on the inner circle. Data is plotted for 500 kb windows, except for sequencing coverage (100 kb). Gene expression (RPKM) was calculated using the sum of the expression counts from all samples within a species.
Figure 2
Figure 2. Impact of repeat expansion on DNA methylation at genomic features.
A) Feature annotation of all cytosines and methylated cytosines. Annotations are shown for all three contexts. B) Genome average of methylation rates for each genomic feature. Methylation rates are normalized to the outgroup species C. rubella. C) Fraction of intron bases annotated as transposable element or other repeat sequence. D) Total number of intron bases (millions) that are annotated as a particular transposable element class. E) Methylation rate distribution across gene bodies of orthologous genes and flanking sequences (1.5 kb up - and downstream). Orthologs that lacked methylation in both their gene body and flanking sequences were excluded. Distributions are plotted by context.
Figure 3
Figure 3. Centromere loss impacts DNA methylation in A. thaliana.
A) Orthologous genes, anchored on the C. rubella genome, were used to calculate several statistics to investigate the impact of centromere loss on DNA methylation in A. thaliana. Capsella rubella centromeres 2, 4, and 8 (grey boxes) were lost during chromosomal fusion events that occurred on the branch leading to A. thaliana. Gene density, repeat density, and methylation densities were calculated for a 20 Kb window centered on the midpoint of each orthologous gene (10 kb up- and 10 kb downstream). Gene density and repeat density were calculated as fractions of each 20 kb window annotated as either a gene (ATG to STOP) or a repeat. Methylation densities were calculated as fractions of cytosines methylated in each context. Gene body methylation and gene expression (RPKM) were calculated for each ortholog. Gene body methylation was calculated as the fraction of methylated CG sites in a gene (ATG to STOP). Gene expression data from all samples within a species were used to calculate the RPKM values. For each statistic, local linear regression was performed to smooth the data in 250 kb bins. Smoothing parameter was relative to chromosome length.
Figure 4
Figure 4. Conservation of methylated regions (MR).
A) Annotation of all bases in MRs. B) Fraction of bases in MRs that occur either within or outside of the three-way whole genome alignments. C) Fraction of MR bases found within three-way whole genome alignments that occur in one, two, or three species. D) Conservation of MRs in the absence of sequence alignments. The total number of orthologous genes overlapping an MR in one, two, or three species is given, with location of MR overlap separated by genomic feature. Upstream region was defined as 1 kb before the start codon. Asterisk indicates two or three-way sharing of MRs that exceeds permutation values.
Figure 5
Figure 5. Methylation rates at orthologs.
A) Pairwise comparison of the average methylation rates at orthologs. Average methylation rate was calculated as the average of all CG sites in the feature, including non-methylated CG sites. Pairwise comparisons are shown for upstream regions (1.5 kb), gene bodies, and downstream regions (1.5 kb). Spearman rank correlation coefficient (ρ) is included for each comparison.
Figure 6
Figure 6. Site-level comparison of methylation.
A) Annotation of all cytosines within a species (covered C) compared to the annotation of cytosines found in the three-way whole genome alignments (aligned C). B) Total number of mC by context for aligned site classes. Site classes are as follows: mC - methylated sites within a species. Conserved (3 species) - sites that are methylated in all three species. Gain - sites that are methylated in a single species. Loss - sites that have lost methylation in a single species. C) Total number of conserved mC and non-conserved mC by context. D) Density plot describing the distribution of variable sites in the genome (10 kb windows). For each window the following statistic was calculated: species-specific methylation gains/sum of species-specific methylation gains and losses. E) Windows with a high density of gains have more transposons and repetitive sequences. Density of transposons plotted against density of methylation gains (10 kb window). F) Methylation gains are enriched at the beginning and end of genes. Fraction of mC in each site class is plotted by exon position in a gene.
Figure 7
Figure 7. Species gene expression and mC relationships.
A) Principal component analysis on fitted gene expression values (log2) and B) mC rates at aligned methylated positions. All contexts are considered (see Fig. 6B,C and Table S10 for further description of mC sites).
Figure 8
Figure 8. Intraspecific variation in DNA methylation.
A) Fraction of mC that are variable between either tissue (root and shoot) or treatment (23°C and 4°C) comparisons. B) Fraction of DMRs that are variable between either tissue (root and shoot) or treatment (23°C and 4°C) comparisons. C) Fraction of DMPs in each context that reside either within a MR or DMR. D) Feature annotation of DMPs by context and DMR bases. E) Fraction of DMPs and DMR bases found within three-way whole genome alignments. F) Fraction of DMPs and DMR bases found within three-way whole genome alignments that occur in one, two, or three species.
Figure 9
Figure 9. Intraspecific variation of transposon and gene body methylation.
A) Comparison of the average methylation rates at annotated transposons and repeats between tissues (root and shoot) and treatments (23°C and 4°C). Average methylation rate is calculated as the average of methylation rates at all cytosines in the feature, including non-methylated cytosines. B) Methylation rate distribution across gene bodies of orthologous genes and flanking sequences (1.5 kb up- and 1.5 kb downstream). Orthologs that lacked methylation in both their gene body and flanking sequences are excluded. Distributions are plotted by context.

References

    1. Feng S, Cokus SJ, Zhang X, Chen PY, Bostick M, et al. (2010) Conservation and divergence of methylation patterning in plants and animals. Proc Natl Acad Sci U S A 107: 8689–8694. - PMC - PubMed
    1. Zemach A, McDaniel IE, Silva P, Zilberman D (2010) Genome-wide evolutionary analysis of eukaryotic DNA methylation. Science 328: 916–919. - PubMed
    1. Suzuki MM, Bird A (2008) DNA methylation landscapes: provocative insights from epigenomics. Nat Rev Genet 9: 465–476. - PubMed
    1. Huff JT, Zilberman D (2014) Dnmt1-independent CG methylation contributes to nucleosome positioning in diverse eukaryotes. Cell 156: 1286–1297. - PMC - PubMed
    1. Gruenbaum Y, Navehmany T, Cedar H, Razin A (1981) Sequence specificity of methylation in higher-plant DNA. Nature 292: 860–862. - PubMed

Publication types

LinkOut - more resources