Randomized Controlled Trial
. 2014 Nov 13;9(11):e112658.
doi: 10.1371/journal.pone.0112658. eCollection 2014.

Longitudinal analysis of T and B cell phenotype and function in renal transplant recipients with or without rituximab induction therapy

Affiliations
Randomized Controlled Trial

Longitudinal analysis of T and B cell phenotype and function in renal transplant recipients with or without rituximab induction therapy

Elena G Kamburova et al. PLoS One. .

Abstract

Background: Prevention of rejection after renal transplantation requires treatment with immunosuppressive drugs. Data on their in vivo effects on T- and B-cell phenotype and function are limited.

Methods: In a randomized double-blind placebo-controlled study to prevent renal allograft rejection, patients were treated with tacrolimus, mycophenolate mofetil (MMF), steroids, and a single dose of rituximab or placebo during transplant surgery. In a subset of patients, we analyzed the number and phenotype of peripheral T and B cells by multiparameter flow cytometry before transplantation, and at 3, 6, 12, and 24 months after transplantation.

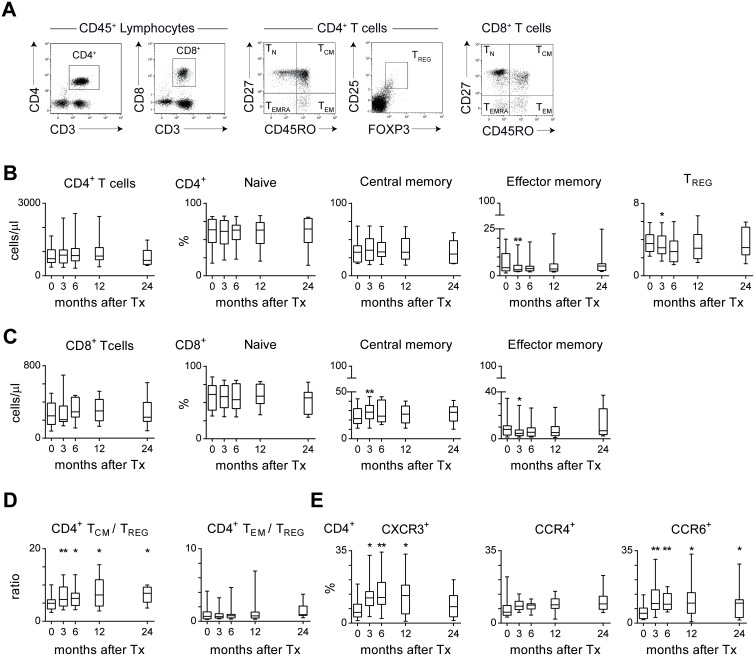
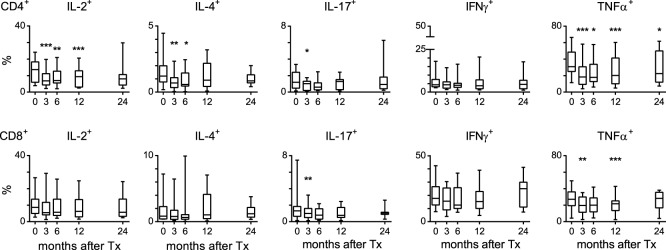
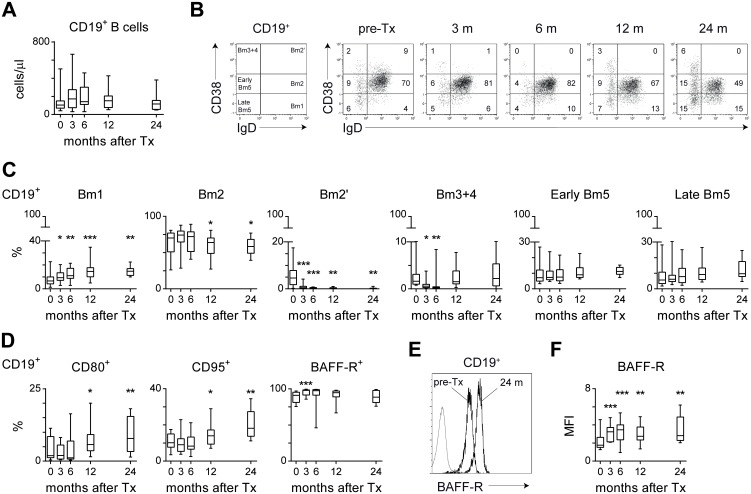
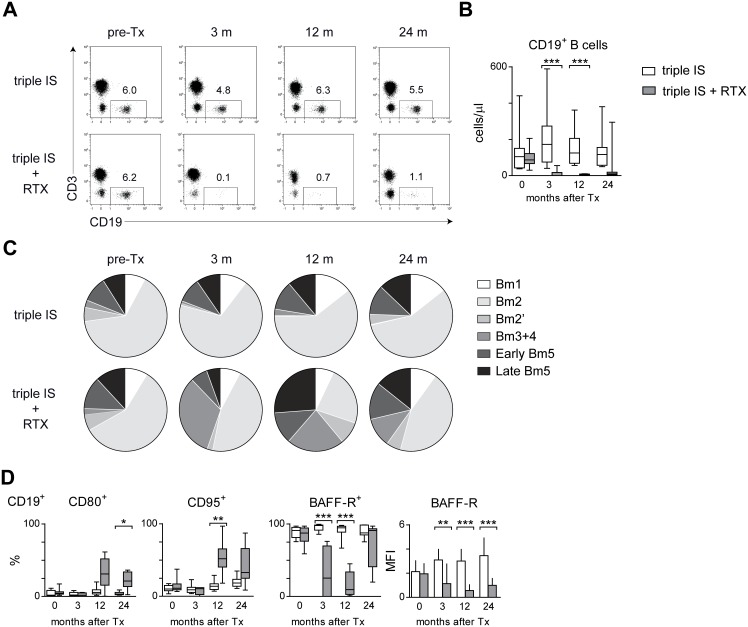
Results: In patients treated with tacrolimus/MMF/steroids the proportion of central memory CD4+ and CD8+ T cells was higher at 3 months post-transplant compared to pre-transplant levels. In addition, the ratio between the percentage of central memory CD4+ and CD4+ regulatory T cells was significantly higher up to 24 months post-transplant compared to pre-transplant levels. Interestingly, treatment with tacrolimus/MMF/steroids resulted in a shift toward a more memory-like B-cell phenotype post-transplant. Addition of a single dose of rituximab resulted in a long-lasting B-cell depletion. At 12 months post-transplant, the small fraction of repopulated B cells consisted of a high percentage of transitional B cells. Rituximab treatment had no effect on the T-cell phenotype and function post-transplant.

Conclusions: Renal transplant recipients treated with tacrolimus/MMF/steroids show an altered memory T and B-cell compartment post-transplant. Additional B-cell depletion by rituximab leads to a relative increase of transitional and memory-like B cells, without affecting T-cell phenotype and function.

Trial registration: ClinicalTrials.gov NCT00565331.


Conflict of interest statement

Competing Interests: The authors of this manuscript have read the journal’s policy and have the following competing interests: LBH has received research funds from Roche, the manufacturer of rituximab. This does not alter the authors’ adherence to PLOS ONE policies on sharing data and materials. The other authors have declared that no competing interests exist.

Figures

Figure 1
Figure 1. Subset distribution of circulating T cells in renal transplant recipients after treatment with tacrolimus, MMF and steroids over time.
(A) Representative dot plots for a renal transplant recipient showing CD3+CD4+ and CD3+CD8+ T cells within the CD45+ lymphocyte population. Circulating CD4+ and CD8+ T cells can be characterized as naive (TN; CD27+CD45RO), central memory (TCM; CD27+CD45RO+), effector memory (TEM; CD27CD45RO+) and highly differentiated memory (TEMRA; CD27+CD45RO) cells. Furthermore, CD4+ T cells can be characterized as regulatory T cells (TREGS; CD25hiFOXP3+). (B) Shown are the absolute numbers of CD4+ T cells and the percentages of TN, TCM and TEM within the CD4+ T-cell population for 14 triple immunosuppression-treated patients before transplantation (t = 0) and at 3, 6, 12 and 24 months after transplantation (n = 10 at 24 m). (C) As described under B, for CD8+ T cells. (D) The ratio between the percentage of CD4+ TCM or TEM and the percentage of TREGS. (E) Longitudinal analysis of the percentages of CXCR3+, CCR4+, and CCR6+ cells within the CD4+ T-cell population of 14 triple immunosuppression-treated patients (n = 10 at 24 m). Results are shown as box plots displaying the median, 25th and 75th percentiles as the box, and the 5th and 95th percentiles as whiskers. Significant differences are indicated compared to pre-transplant levels: *P<0.05, **P<0.01.
Figure 2
Figure 2. Ex vivo cytokine production by circulating T cells in renal transplant recipients after treatment with tacrolimus, MMF and steroids.
Peripheral blood mononuclear cells (PBMCs) were stimulated for 4 hours in the presence of PMA, ionomycin and Brefeldin A. Shown are the percentages IL-2, IL-4, IL-17, IFNγ or TNFα-producing cells within the CD4+ or CD8+ T-cell population of 14 triple immunosuppression-treated patients before transplantation (t = 0) and at 3, 6, 12, and 24 months after transplantation (n = 10 at 24 m). Results are shown as box plots displaying the median, 25th and 75th percentiles as the box, and the 5th and 95th percentiles as whiskers. Significant differences are indicated compared to pre-transplant levels: *P<0.05, **P<0.01, ***P<0.001.
Figure 3
Figure 3. Longitudinal analysis of circulating B cells in renal transplant recipients after treatment with tacrolimus, MMF and steroids.
(A) Shown are the absolute numbers of CD19+ B cells of 14 triple immunosuppression-treated patients before transplantation (t = 0) and at 3, 6, 12, and 24 months after transplantation (n = 10 at 24 m). (B) Representative dot plots for a renal transplant recipient over time using the Bm1-Bm5 classification: Bm1 (IgD+CD38), Bm2 (IgD+CD38+), Bm2’ (IgD+CD38++), Bm3+4 (IgDCD38++), Early Bm5 (IgDCD38+) and Late Bm5 (IgDCD38) cells within the CD19+ B-cell population. (C) Shown are the percentages of the different B-cell subsets using the Bm1-Bm5 classification over time. (D) Shown are the percentages of CD80+, CD95+, and BAFF-receptor+ (BAFF-R) cells within the CD19+ B-cell population. (E) Overlay plot of the BAFF-R expression (MFI: median fluorescence intensity) within the CD19+ B-cell population of one patient before transplantation (pre-Tx) and 24 months (24 m) after transplantation under treatment with tacrolimus, MMF and steroids. Gray line shows unstained cells. (F) Summary graph showing the BAFF-R MFI of 14 triple immunosuppression-treated patients before over time (n = 10 at 24 m). Results are shown as box plots displaying the median, 25th and 75th percentiles as the box, and the 5th and 95th percentiles as whiskers. Significant differences are indicated compared to pre-transplant (pre-Tx; t = 0) levels: *P<0.05, **P<0.01, ***P<0.001.
Figure 4
Figure 4. Longitudinal analysis of circulating B cells in renal transplant recipients after treatment with tacrolimus, MMF and steroids, and a single dose of rituximab (RTX) during transplant surgery.
(A) Representative dot plots of CD19+ B cells within the CD45+ lymphocyte population for a RTX-treated and a triple immunosuppression (IS)-treated patient before transplantation (pre-Tx) and at 3, 12, and 24 months after transplantation. (B) Shown are the absolute numbers of CD19+ B cells for RTX-(gray, n = 12) and triple IS-treated (white, n = 14) patients before transplantation (t = 0) and up to 24 months after transplantation (n = 10 and n = 9 at t = 24 m, respectively). (C) Pie charts depicting the distribution the different B cells subsets over time using the Bm1-Bm5 classification as depicted in Figure 3B: Bm1 (IgD+CD38), Bm2 (IgD+CD38+), Bm2’ (IgD+CD38++), Bm3+4 (IgDCD38++), Early Bm5 (IgDCD38+) and Late Bm5 (IgDCD38) cells within the CD19+ B-cell population. Data are represented as means of 14 triple IS+RTX-treated and 12 IS-treated patients before transplantation (pre-Tx) and at 3, 12, and 24 months after transplantation (n = 10 and n = 9 at t = 24 m, respectively). (D) Shown are the percentages of CD80+, CD95+ and BAFF-R+ cells within the CD19+ B-cell population for RTX- (gray, n = 12) and triple IS-treated (white, n = 14) patients before transplantation (t = 0) and up to 24 months after transplantation. Results are shown as box plots displaying the median, 25th and 75th percentiles as the box, and the 5th and 95th percentiles as whiskers. Significant differences are indicated by asterisks: **P<0.01.

References

    1. Chapman JR, O’Connell PJ, Nankivell BJ (2005) Chronic renal allograft dysfunction. J Am Soc Nephrol 16: 3015–3026. - PubMed
    1. Safinia N, Afzali B, Atalar K, Lombardi G, Lechler RI (2010) T-cell alloimmunity and chronic allograft dysfunction. Kidney International 78 Suppl 119: S2–12. - PubMed
    1. Kahan BD (2003) Individuality: the barrier to optimal immunosuppression. Nat Rev Immunol 3: 831–838. - PubMed
    1. Wood KJ, Bushell A, Hester J (2012) Regulatory immune cells in transplantation. Nat Rev Immunol 12: 417–430. - PubMed
    1. Kreijveld E, Koenen HJ, van Cranenbroek B, van Rijssen E, Joosten I, et al. (2008) Immunological monitoring of renal transplant recipients to predict acute allograft rejection following the discontinuation of tacrolimus. PLoS One 3: e2711. - PMC - PubMed

Publication types

MeSH terms

Associated data