

GPA: a statistical approach to prioritizing GWAS results by integrating pleiotropy and annotation
- PMID: 25393678
- PMCID: PMC4230845
- DOI: 10.1371/journal.pgen.1004787
GPA: a statistical approach to prioritizing GWAS results by integrating pleiotropy and annotation
Abstract
Results from Genome-Wide Association Studies (GWAS) have shown that complex diseases are often affected by many genetic variants with small or moderate effects. Identifications of these risk variants remain a very challenging problem. There is a need to develop more powerful statistical methods to leverage available information to improve upon traditional approaches that focus on a single GWAS dataset without incorporating additional data. In this paper, we propose a novel statistical approach, GPA (Genetic analysis incorporating Pleiotropy and Annotation), to increase statistical power to identify risk variants through joint analysis of multiple GWAS data sets and annotation information because: (1) accumulating evidence suggests that different complex diseases share common risk bases, i.e., pleiotropy; and (2) functionally annotated variants have been consistently demonstrated to be enriched among GWAS hits. GPA can integrate multiple GWAS datasets and functional annotations to seek association signals, and it can also perform hypothesis testing to test the presence of pleiotropy and enrichment of functional annotation. Statistical inference of the model parameters and SNP ranking is achieved through an EM algorithm that can handle genome-wide markers efficiently. When we applied GPA to jointly analyze five psychiatric disorders with annotation information, not only did GPA identify many weak signals missed by the traditional single phenotype analysis, but it also revealed relationships in the genetic architecture of these disorders. Using our hypothesis testing framework, statistically significant pleiotropic effects were detected among these psychiatric disorders, and the markers annotated in the central nervous system genes and eQTLs from the Genotype-Tissue Expression (GTEx) database were significantly enriched. We also applied GPA to a bladder cancer GWAS data set with the ENCODE DNase-seq data from 125 cell lines. GPA was able to detect cell lines that are biologically more relevant to bladder cancer. The R implementation of GPA is currently available at http://dongjunchung.github.io/GPA/.
Conflict of interest statement
The authors have declared that no competing interests exist.
Figures
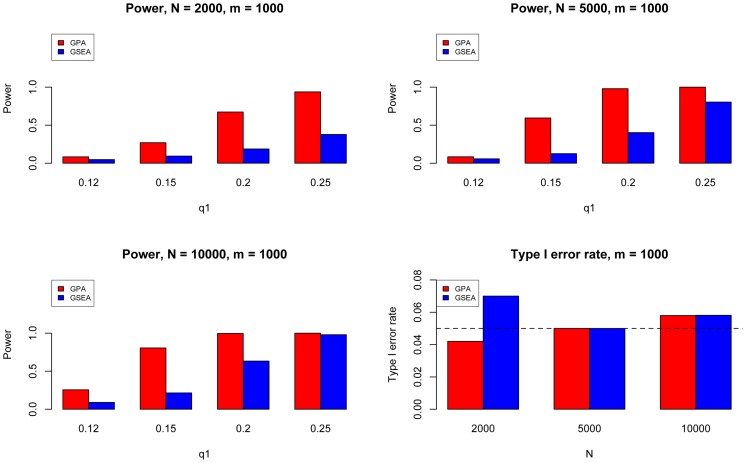
 and varied
  to evaluate the power for sample size
  = 2000 (Upper Left panel), 5000 (Upper Right panel), 10000 (Lower Left panel), respectively. We used
  to evaluate the type I errors (Lower Right panel). The results are based on 500 simulations.
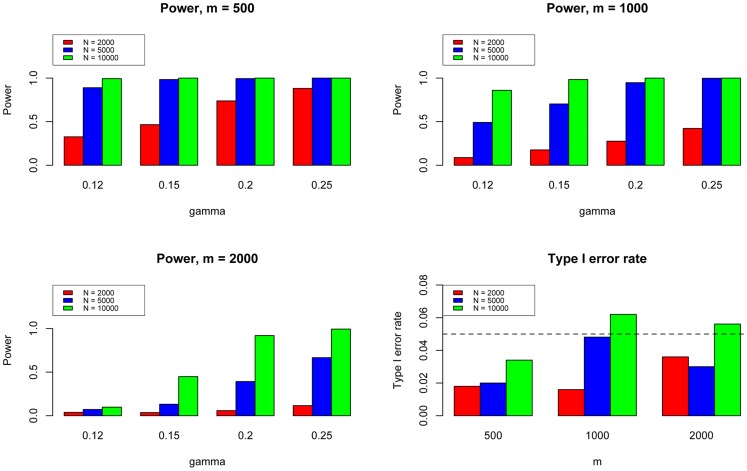
 to evaluate the type I errors of the pleiotropy test (Lower Right panel). In each setting, we also varied sample size
  = 1000, 2000, and 10000. Note that type I error rate and power of the pleiotropy test remain almost the same in presence of annotation (see Figure S9 in Text S1).
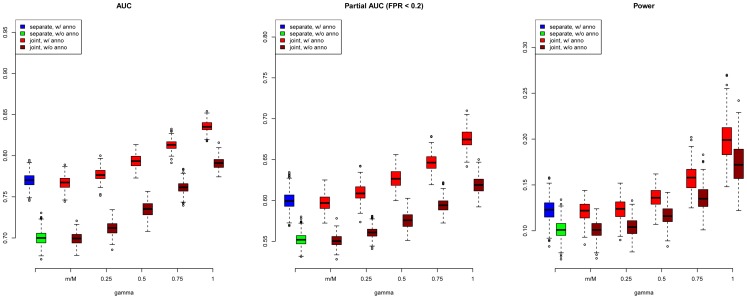
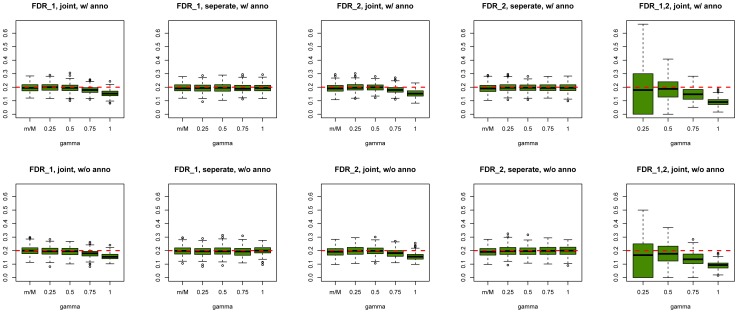
 = 0.05 and 0.1, respectively.
 = 0.05 and 0.1, respectively.
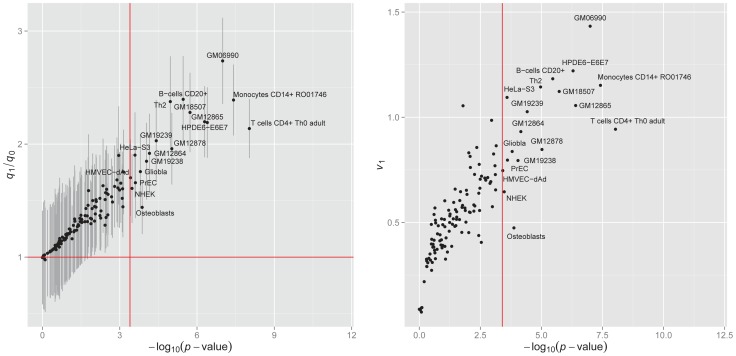
 of hypothesis testing (13) vs. fold enrichment
  . The vertical red line corresponds to the significance level (
 = 0.05) after Bonferroni correction. The horizontal red line corresponds to ratio = 1. Right panel: The normalized variance component
  (2) given by LMM v.s.
  given by GPA.
References
Publication types
MeSH terms
Grants and funding
- R01 DA18432/DA/NIDA NIH HHS/United States
- R01 DA012690/DA/NIDA NIH HHS/United States
- R01 DA012849/DA/NIDA NIH HHS/United States
- R01 DA12849/DA/NIDA NIH HHS/United States
- R01 DA018432/DA/NIDA NIH HHS/United States
- R01 AA017535/AA/NIAAA NIH HHS/United States
- R01 DA12690/DA/NIDA NIH HHS/United States
- R01 GM059507/GM/NIGMS NIH HHS/United States
- R01 GM122078/GM/NIGMS NIH HHS/United States
- RC2 DA028909/DA/NIDA NIH HHS/United States
- UL1 RR024139/RR/NCRR NIH HHS/United States
- R01 GM59507/GM/NIGMS NIH HHS/United States
- R01 AA11330/AA/NIAAA NIH HHS/United States
- R01 DA030976/DA/NIDA NIH HHS/United States
- R01 AA011330/AA/NIAAA NIH HHS/United States
- UL1 TR000142/TR/NCATS NIH HHS/United States
- P50 AA12870/AA/NIAAA NIH HHS/United States
- P50 AA012870/AA/NIAAA NIH HHS/United States
LinkOut - more resources
Full Text Sources
Other Literature Sources
Medical
Molecular Biology Databases
