

Interleukin-6, high sensitivity C-reactive protein, and the development of type 2 diabetes among HIV-positive patients taking antiretroviral therapy
- PMID: 25393940
- PMCID: PMC4231540
- DOI: 10.1097/QAI.0000000000000354
Interleukin-6, high sensitivity C-reactive protein, and the development of type 2 diabetes among HIV-positive patients taking antiretroviral therapy
Abstract
Background: HIV infection is associated with increased levels of inflammatory markers. Inflammation is hypothesized to play a role in the development of type 2 diabetes. Data addressing this issue among HIV-positive participants are limited.
Methods: A cohort of 3695 participants without diabetes, taking antiretroviral therapy and with an average CD4⁺ count of 523 cells/mm³, were followed for an average of 4.6 years. Diabetes risk associated with baseline levels of high sensitivity C-reactive protein (hsCRP) and interleukin-6 (IL-6) was assessed using Cox proportional hazards regression models. Analyses considered baseline levels of factors associated with diabetes risk and HIV-related measures.
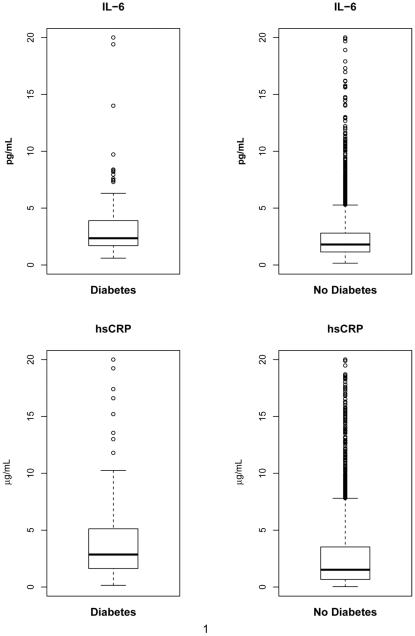
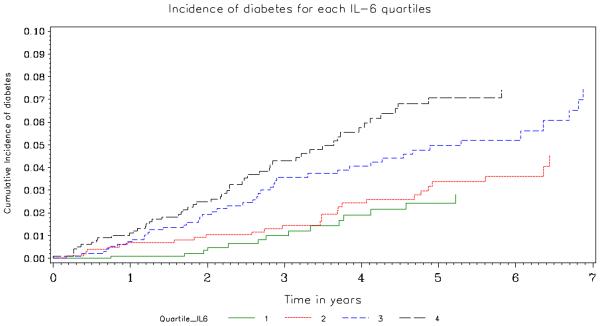
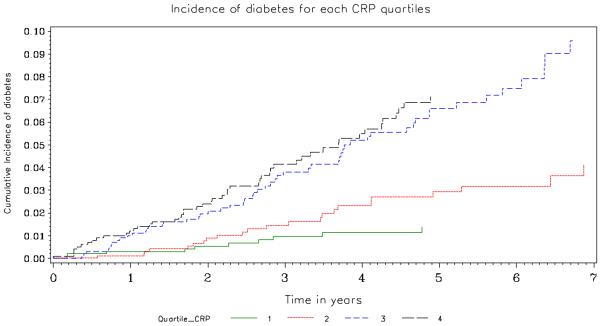
Results: One hundred thirty-seven patients developed diabetes requiring drug treatment during follow-up (8.18 per 1000 person-years). Median levels of IL-6 and hsCRP were significantly higher among those who developed diabetes compared with those who did not: 3.45 versus 2.50 pg/mL for IL-6 and 4.91 versus 3.29 µg/mL for hsCRP (P < 0.001). Adjusted hazard ratios associated with a doubling of IL-6 and hsCRP were 1.29 (95% confidence interval: 1.08 to 1.55; P = 0.005) and 1.22 (95% confidence interval: 1.10 to 1.36; P < 0.001), respectively. Body mass index (P < 0.001), age (P = 0.013), coinfection with hepatitis B or C (P = 0.03), nonsmoking status (P = 0.034), and use of lipid-lowering treatment (P = 0.008) were also associated with an increased risk of diabetes.
Conclusions: These findings indicate that low-grade systemic inflammation is an underlying factor in the pathogenesis of diabetes.
Figures
References
-
- Samaras K. The burden of diabetes and hyperlipidemia in treated HIV infection and approaches for cardiometabolic care. Curr HIV/AIDS Rep. 2012 Sep;9(3):206–217. - PubMed
-
- Brown TT, Cole SR, Li X, Kingsley LA, Palella FJ, Riddler SA, Visscher BR, Margolick JB, Dobs AS. Antiretroviral therapy and the prevalence and incidence of diabetes mellitus in the multicenter AIDS cohort study. Arch Intern Med. 2005 May 23;165(10):1179–1184. - PubMed
-
- De Wit S, Sabin CA, Weber R, Worm SW, Reiss P, Cazanave C, El-Sadr W, Monforte A, Fontas E, Law MG, Friis-Moller N, Phillips A. Data Collection on Adverse Events of Anti-HIV Drugs (D:A:D) study. Incidence and risk factors for new-onset diabetes in HIV-infected patients: The data collection on adverse events of anti-HIV drugs (D:A:D) study. Diabetes Care. 2008 Jun;31(6):1224–1229. - PMC - PubMed
-
- Tien PC, Schneider MF, Cole SR, Levine AM, Cohen M, DeHovitz J, Young M, Justman JE. Antiretroviral therapy exposure and incidence of diabetes mellitus in the women's interagency HIV study. AIDS. 2007 Aug 20;21(13):1739–1745. - PubMed
-
- Mocroft A, Neuhaus J, Peters L, Ryom L, Bickel M, Grint D, Koirala J, Szymczak A, Lundgren J, Ross MJ, Wyatt CM, INSIGHT SMART Study Group, ESPRIT Study Group Hepatitis B and C co-infection are independent predictors of progressive kidney disease in HIV-positive, antiretroviral-treated adults. PLoS One. 2012;7(7):e40245. - PMC - PubMed
Publication types
MeSH terms
Substances
Grants and funding
LinkOut - more resources
Full Text Sources
Other Literature Sources
Medical
Research Materials
