Clinical Trial
. 2014 Nov 13;9(11):e112797.
doi: 10.1371/journal.pone.0112797. eCollection 2014.

Inactivation of human salivary glutathione transferase P1-1 by hypothiocyanite: a post-translational control system in search of a role

Affiliations
Clinical Trial

Inactivation of human salivary glutathione transferase P1-1 by hypothiocyanite: a post-translational control system in search of a role

Raffaele Fabrini et al. PLoS One. .

Abstract

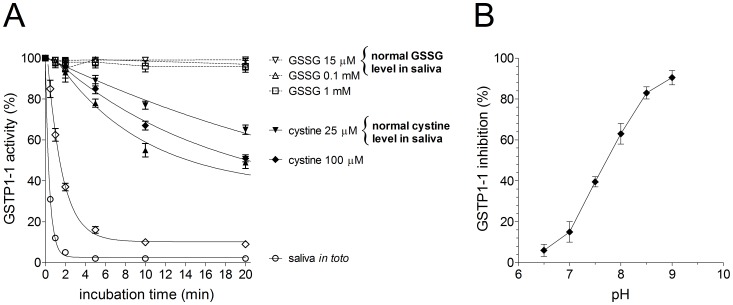
Glutathione transferases (GSTs) are a superfamily of detoxifying enzymes over-expressed in tumor tissues and tentatively proposed as biomarkers for localizing and monitoring injury of specific tissues. Only scarce and contradictory reports exist about the presence and the level of these enzymes in human saliva. This study shows that GSTP1-1 is the most abundant salivary GST isoenzyme, mainly coming from salivary glands. Surprisingly, its activity is completely obscured by the presence of a strong oxidizing agent in saliva that causes a fast and complete, but reversible, inactivation. Although salivary α-defensins are also able to inhibit the enzyme causing a peculiar half-site inactivation, a number of approaches (mass spectrometry, site directed mutagenesis, chromatographic and spectrophotometric data) indicated that hypothiocyanite is the main salivary inhibitor of GSTP1-1. Cys47 and Cys101, the most reactive sulfhydryls of GSTP1-1, are mainly involved in a redox interaction which leads to the formation of an intra-chain disulfide bridge. A reactivation procedure has been optimized and used to quantify GSTP1-1 in saliva of 30 healthy subjects with results of 42±4 mU/mg-protein. The present study represents a first indication that salivary GSTP1-1 may have a different and hitherto unknown function. In addition it fulfills the basis for future investigations finalized to check the salivary GSTP1-1 as a diagnostic biomarker for diseases.


Conflict of interest statement

Competing Interests: The authors have declared that no competing interests exist.

Figures

Figure 1
Figure 1. Inactivation of Alpha, Mu and Pi class GSTs by human saliva.
(A) GSTP1-1 (open circle) (20 pmoles), GSTA1-1 (open square) (20 pmoles), GSTM2-2 (open diamond) (20 pmoles) were incubated (25°C) with 70 µl of saliva. GSTP1-1 was also incubated with the same salivary sample diluted 1∶10 (full circle). (B) GSTP1-1 (open circle) inactivated as in A for 20 min and then treated with 1 mM DTT at 37°C. Each experiment was performed in triplicate (i.e. three different spectrophotometric determinations on the same salivary sample). Error bars represent SEM.
Figure 2
Figure 2. Stoichiometry of GSTP1-1 inactivation by saliva.
GSP1-1 (20 pmoles) was incubated with human saliva (70 µl) as such or at variable dilutions (open circle: no dilution; open diamond 1∶5; open triangle: 1∶10; open square 1∶20; reverse triangle 1∶40, asterisk 1∶50 and cross 1∶100) and at different incubation time (25°C). Each experiment was performed in triplicate (i.e. three different spectrophotometric determinations on the same salivary sample). Error bars represent SEM.
Figure 3
Figure 3. Inhibition of cysteine variants of GSTP1-1 by saliva.
(A) C47S variant (20 pmoles) incubated at 25°C with 70 µl of saliva (open circle) or saliva 1∶20 diluted (open triangle). (B) C101S variant (20 pmoles) incubated with 70 µl saliva (open circle) or saliva diluted 1∶10 (cross). (C) C47S/C101S double variant (20 pmoles) incubated with 70 µl of saliva (open diamond). Each experiment was performed in triplicate (i.e. three different spectrophotometric determinations on the same sample). Error bars represent SEM.
Figure 4
Figure 4. Inactivation of GSTP1-1 by human defensins (HNP-1 and HNP-2).
GSTP1-1 (90 pmoles) was incubated at 25°C with HNP-1 (0.54 nmoles) (open triangle), HNP-2 (open diamond) (0.54 nmoles) and both HNP-1 0.27 nmoles and HNP-2 (0.27 nmoles) (open square) in 70 µl (final volume) of potassium phosphate buffer, pH 7.0 (these defensin levels reproduce the average concentration of these proteins in saliva). An identical amount of GSTP1-1 was also incubated with 70 µl saliva (open circle). Each experiment was performed in triplicate (i.e. three different spectrophotometric determinations on the same sample). Error bars represent SEM.
Figure 5
Figure 5. Size-exclusion chromatography of the unknown inhibitor.
Experiments were made using a Biogel P-2 resin as described under Experimental Procedures. Molecular markers: GSH, TNB, cysteine, phenol, and thyocianate. The arrow indicates the elution volume of the unknown inhibitor, corresponding to a molecular mass of about 70–85 Da. Error bars represent SEM.
Figure 6
Figure 6. Inactivation of GSTP1-1 by GSSG and CysSSCys.
(A) GSTP1-1 (20 pmoles) incubated at 25°C with variable amounts of oxidized glutathione or oxidized cysteine in 70 µl of 0.1 M potassium phosphate buffer, pH 7.0. For comparison the same amount of GSTP1-1 was incubated with 70 µl saliva. (B) pH dependence of the inactivation by cystine (100 µM). The activity was evaluated after 5 min of incubation. Each experiment was performed in triplicate (i.e. three different spectrophotometric determinations on the same sample). Error bars represent SEM.
Figure 7
Figure 7. Inhibition of purified GSTP1-1 by H2O2.
GSTP1-1 (20 pmoles) was incubated at 25°C with two different concentrations of H2O2, 10 µM, corresponding to the physiological level (open triangle) and 100 µM (open square) in 70 µl potassium phosphate buffer, pH 7.0. For comparison GSTP1-1 (20 pmoles) was also incubated with 70 µl of saliva (open circle). Each experiment was performed in triplicate (i.e. three different spectrophotometric determinations on the same sample). Error bars represent SEM.
Figure 8
Figure 8. Inhibition pattern of GSTP1-1 by salivary samples or authentic HOSCN.
(A) Purified GSTP1-1 (20 pmoles) incubated with authentic HOSCN (10, 1, and 0.5 µM). (B) Purified GSTP1-1 (20 pmoles) was at 25°C incubated with 70 µl of saliva (full circle) (estimated inhibitor concentration 10 µM) or at different dilutions (full square 1∶10; full diamond 1∶20). Each experiment was performed in triplicate (i.e. three different spectrophotometric determinations on the same sample). Error bars represent SEM.
Figure 9
Figure 9. pH dependence of GSTP1-1 inhibition.
(A) Purified GSTP1-1 (20 pmoles) incubated with saliva (estimated inhibitor concentration 5 µM) at different pH values (from 4.3 to 8.0) with suitable additions of 0.1 M potassium dihydrogen phosphate or 0.1 M potassium monohydrogen phosphate. After incubation (1 min, 25°C) the activity was measured. (B) GSTP1-1 incubated as in (A) with authentic HOSCN 5 µM. Each experiment was performed in triplicate (i.e. three different spectrophotometric determinations on the same salivary sample). Error bars represent SEM.
Figure 10
Figure 10. Interaction of GSTP1-1 with saliva or authentic OSCN after reaction with TNB.
GSTP1-1 (20 pmoles) was incubated for 10 min at 25°C in 70 µl of saliva (estimated level of OSCN = 5–10 µM). In a second experiment, before the addition of GSTP1-1, the saliva sample was treated with 10 µM of TNB, and then with the same amount of GSH to remove DTNB. The same experiment was also performed in the absence of saliva, using authentic hypothiocyanite (5 µM) in potassium phosphate buffer pH 7.0. Each experiment was performed in triplicate (i.e. three different spectrophotometric determinations on the same sample). Error bars represent SEM.
Figure 11
Figure 11. Reactivation rate of GSTP1-1.
Purified GSTP1-1 (20 pmoles) was incubated with HOSCN (10 µM, final concentration) for 20 min, 25°C. Then the samples were incubated with DTT at different concentrations for 2.5 min, 37°C in potassium phosphate buffer 0.1 M, pH 8.4, and the activity was measured. Each experiment was performed in triplicate (i.e. three different spectrophotometric determinations on the same sample). Error bars represent SEM.
Figure 12
Figure 12. Inter-day and intra-day levels of salivary GSTP1-1.
(A) Inter-day activity of GSTP1-1 (early morning recovery -Men+women). (B) Sex distribution of the salivary GSTP1-1 as average of three days (early morning recovery). (C) Average of salivary GSTP1-1 (men+women) during three days at different time of saliva recovery (8 am, 11 am, 3 pm). Values expressed as mU/mg of salivery proteins. (D) as in (C) with GSTP1-1 activity expressed as mU/ml of saliva. Error bars represent SEM.

References

    1. Amado FM, Ferreira RP, Vitorino R (2013) One decade of salivary proteomics: current approaches and outstanding challenges. Clin Biochem 46: 506–517. - PubMed
    1. Bonne NJ, Wong DT (2012) Salivary biomarker development using genomic, proteomic and metabolomic approaches. Genome Med 4: 82. - PMC - PubMed
    1. Cabras T, Iavarone F, Manconi B, Olianas A, Sanna MT, et al. (2014) Top-down analytical platforms for the characterization of the human salivary proteome. Bioanalysis 6: 563–581. - PubMed
    1. Castagnola M, Cabras T, Vitali A, Sanna MT, Messana I (2011) Biotechnological implications of the salivary proteome. Trends Biotechnol 29: 409–418. - PubMed
    1. Oppenheim FG, Salih E, Siqueira WL, Zhang W, Helmerhorst EJ (2007) Salivary proteome and its genetic polymorphisms. Ann NY Acad Sci 1098: 22–50. - PubMed

Publication types