. 2015 Jun;22(6):974-85.
doi: 10.1038/cdd.2014.186. Epub 2014 Nov 14.

Epo-induced erythroid maturation is dependent on Plcγ1 signaling

Affiliations

Epo-induced erythroid maturation is dependent on Plcγ1 signaling

T M Schnöder et al. Cell Death Differ. 2015 Jun.

Abstract

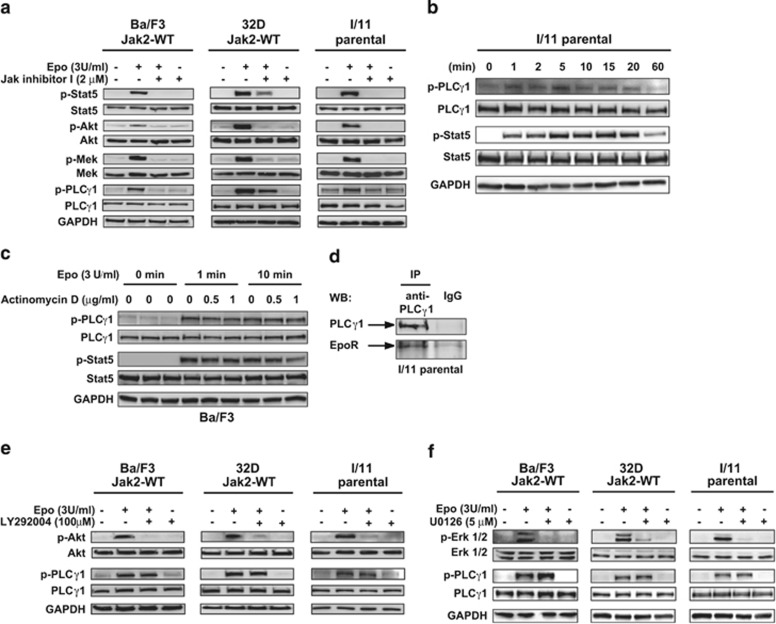
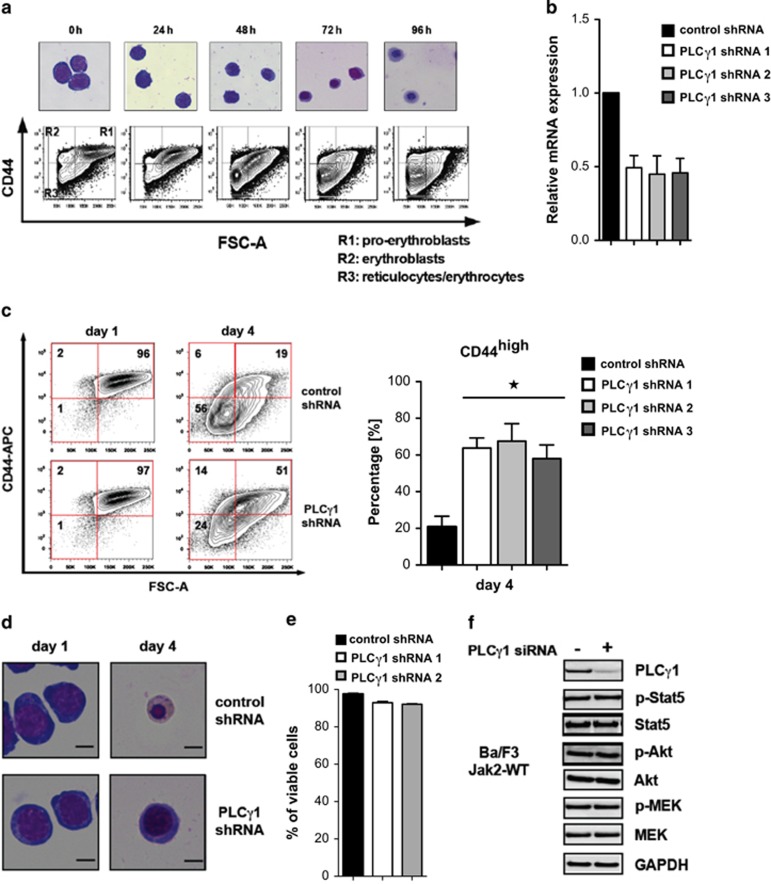
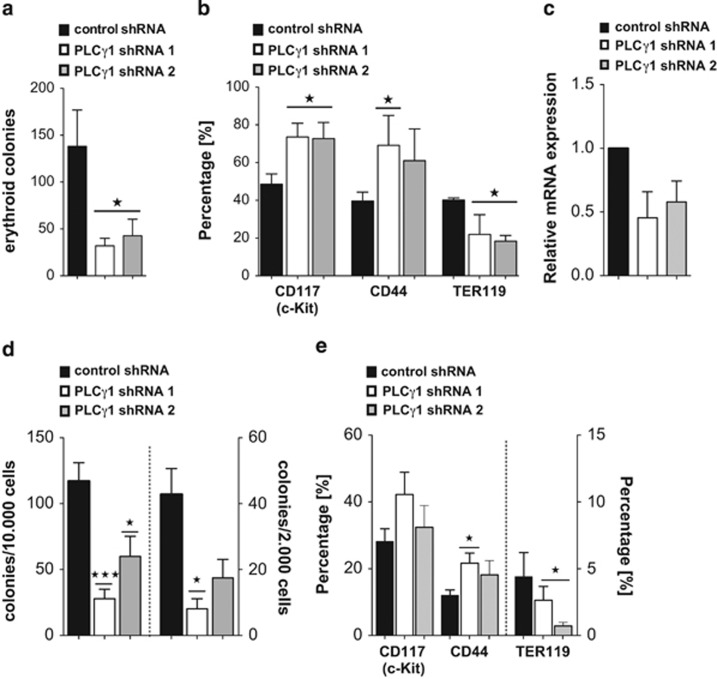
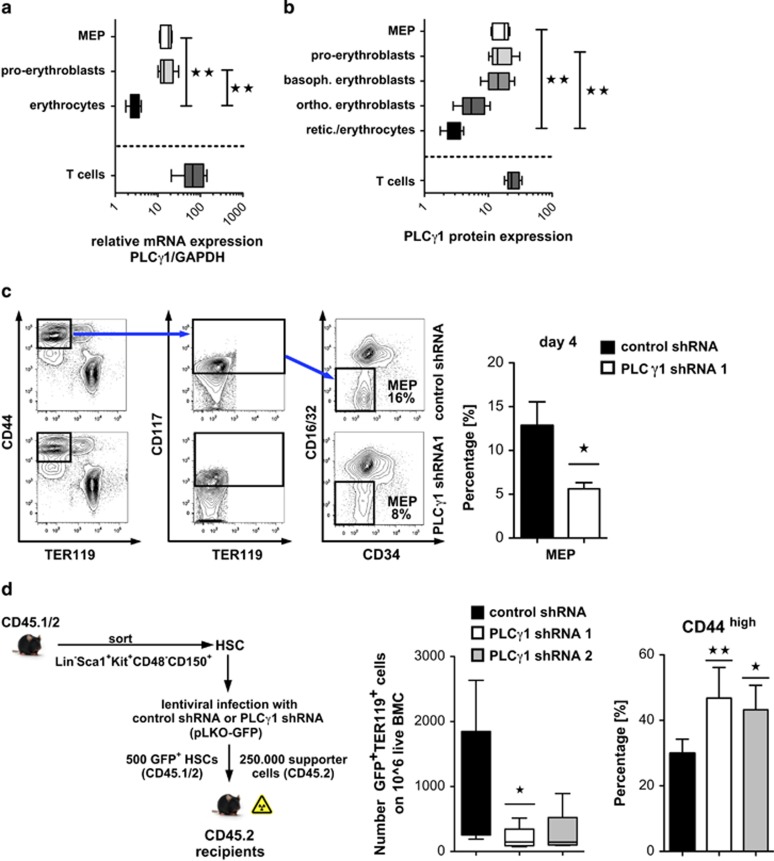
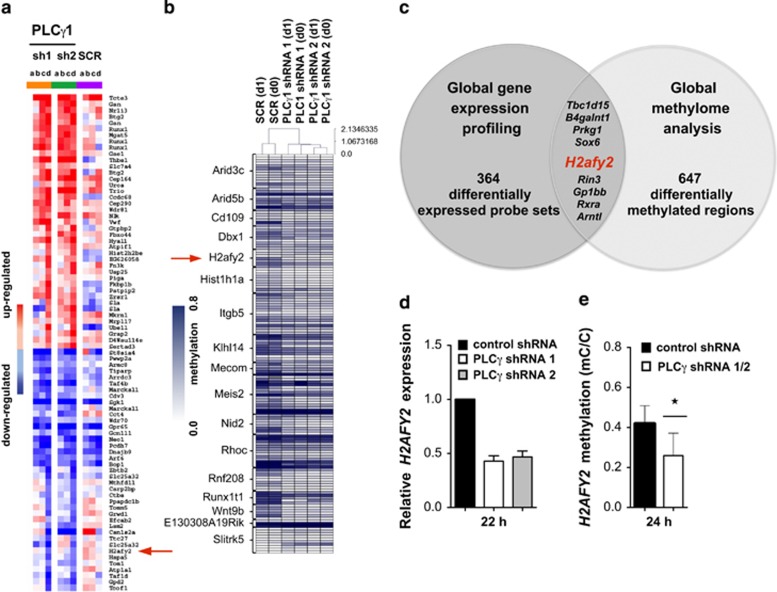
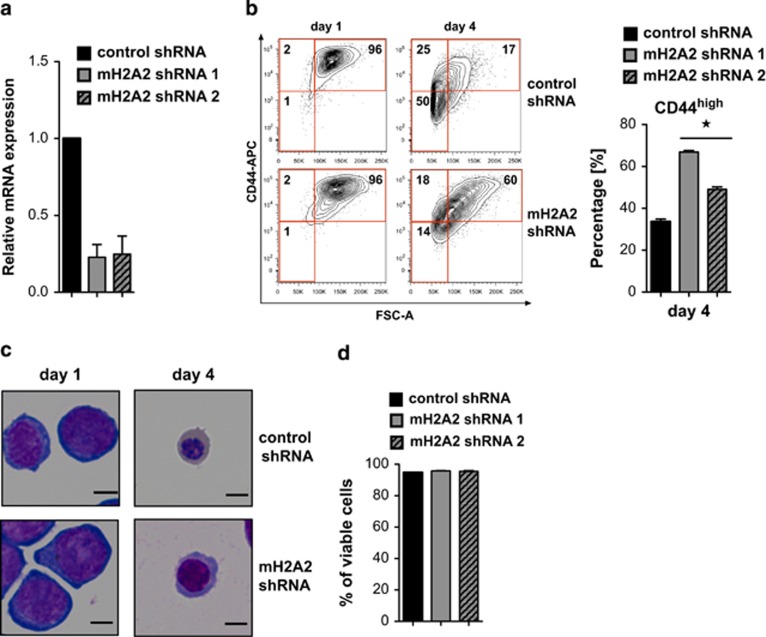
Erythropoiesis is a tightly regulated process. Development of red blood cells occurs through differentiation of hematopoietic stem cells (HSCs) into more committed progenitors and finally into erythrocytes. Binding of erythropoietin (Epo) to its receptor (EpoR) is required for erythropoiesis as it promotes survival and late maturation of erythroid progenitors. In vivo and in vitro studies have highlighted the requirement of EpoR signaling through Janus kinase 2 (Jak2) tyrosine kinase and Stat5a/b as a central pathway. Here, we demonstrate that phospholipase C gamma 1 (Plcγ1) is activated downstream of EpoR-Jak2 independently of Stat5. Plcγ1-deficient pro-erythroblasts and erythroid progenitors exhibited strong impairment in differentiation and colony-forming potential. In vivo, suppression of Plcγ1 in immunophenotypically defined HSCs (Lin(-)Sca1(+)KIT(+)CD48(-)CD150(+)) severely reduced erythroid development. To identify Plcγ1 effector molecules involved in regulation of erythroid differentiation, we assessed changes occurring at the global transcriptional and DNA methylation level after inactivation of Plcγ1. The top common downstream effector was H2afy2, which encodes for the histone variant macroH2A2 (mH2A2). Inactivation of mH2A2 expression recapitulated the effects of Plcγ1 depletion on erythroid maturation. Taken together, our findings identify Plcγ1 and its downstream target mH2A2, as a 'non-canonical' Epo signaling pathway essential for erythroid differentiation.


Figures

Figure 1
Figure 1
Plcγ-1 is a direct downstream target of EpoR–Jak2 signaling. (a) Western blot analysis of Ba/F3 and 32D cells stably transfected with EpoR and Jak2-WT and of the erythroid progenitor cell line I/11. Analysis was performed using phospho (p) and total antibodies. These data are representative results of three independent experiments. (b) Kinetic analysis of the erythroid progenitor cell line I/11. These blots are representative results of three independent experiments. (c) Western blot analysis of cells treated with Actinomycin D (2 h; 0.5, 1 μg/ml). These data are representative results of three independent experiments. (d) Co-immunoprecipitation of Plcγ-1 and EpoR in erythroid progenitor cells (I/11). Immunoprecipitation was performed with antibodies specific for Plcγ-1. Western blotting of the precipitate was performed with anti-EpoR antibodies. These data are representative results of three independent experiments. (e and f) Western blot analysis of Ba/F3 and 32D cells stably transfected with EpoR and Jak2-WT and of the erythroid progenitor cell line I/11. Cells were treated with LY292004 (1 h; 100 μM) and U0126 (1 h; 5 μM), respectively. These blots are representative results of three independent experiments
Figure 2
Figure 2
Plcγ-1 regulates differentiation of erythroid progenitors. (a) Cytospin analysis followed by Giemsa staining of cells induced to differentiate in response to Epo; for flow cytometry analysis I/11 cells were labeled with antibodies against TER119 and CD44. Shown is a representative analysis of CD44 expression as function of forward scatter for all TER119-positive cells. (b) Quantitative RT-PCR of Plcγ1 mRNA in I/11 cells after infection with either Plcγ1 shRNA or control shRNA. Each experiment was done in triplicate and the error bars represent mean±S.D. (n=3). (c) Differentiation of I/11 cells stably infected with either Plcγ1 shRNAs or control shRNA was measured for 96 h (day 4) in response to Epo. Flow cytometry analysis was performed using antibodies against TER119 and CD44 and gating was performed as described in a; SYTOX Blue Dead Cell Stain was used to exclude dead cells. A representative FACS blot (left panel) and percentage of immature (TER119+CD44high) cells after 96 h (day 4; right panel) is shown. The error bars represent mean±S.D. (n=3). (d) Representative cytospin analysis followed by Giemsa staining of Plcγ1-deficient and control cells induced to differentiate in response to Epo. The scale bar represents 5 μm. (e) Survival of I/11 cells stably infected with either Plcγ1 shRNA or control shRNA using Annexin V/SYTOX Blue staining. The error bars represent mean±S.D. (n=3). (f) Ba/F3 cells stably expressing EpoR and Jak2-WT were transfected with control (neg.) or Plcγ1 siRNA and were serum starved 24 h after knockdown and then stimulated with 3 U/ml Epo for 10 min. Western analysis was performed using using phospho (p) and total antibodies. These blots are representative results of three independent experiments
Figure 3
Figure 3
Plcγ-1 regulates colony formation in erythroid progenitors and primary FLCs. (a) I/-11 cells infected with either Plcγ1 or control shRNA were plated in methylcellulose supplemented with Epo (10 U/ml) and transferrin (0.5 mg/ml); colonies were counted after 10 days. Each experiment was done in triplicate, error bars represent mean±S.E.M. (n=4). (b) Immunophenotype of colonies was investigated by flow cytometry using markers against CD44, TER119 and CD117 (c-Kit). Error bars represent mean±S.D. (n=4). (c) Quantitative RT-PCR of Plcγ1 mRNA in FLC after infection with either Plcγ1 shRNAs or control shRNA. Each experiment was done in triplicate and the error bars represent mean ± S.D. (n=2). (d) FLC of C57BL/6J mice (five independent experiments, n=5) were harvested at day E13.5 and infected with either Plcγ1 or control shRNA. For each experiment, cells were seeded in methylcellulose supplemented with cytokines at two different concentrations (10 000/2000 cells) and colonies were counted after 10 days. Each concentration in each independent experiment was done in triplicate, error bars represent mean±S.E.M. (e) Immunophenotype of colonies was investigated by flow cytometry. Error bars represent mean±S.E.M. (n=5)
Figure 4
Figure 4
Plcγ1 is essential for erythroid differentiation of adult BM cells in vitro and in vivo. (a) Relative expression of Plcγ1 mRNA in sorted BM cells of C57BL/6J mice (n=5), determined by qPCR. Each experiment was done in triplicate, error bars represent mean±S.D. (b) Intracellular Plcγ1 protein expression was analyzed in different BM compartments of C57BL/6J mice (n=5) using flow cytometry. Error bars represent mean±S.D. (c) Lineage-depleted/erythroid-enriched (Gr1-, B220-, CD3/4/8-, CD19-/IL-7Rα-negative) BM cells of C57BL/6J mice (n=4) were infected with either Plcγ1 or control shRNA. Differentiation was measured by flow cytometry over a time period of 96 h (day 4). A representative FACS blot (left panel) and percentage of MEP cells after 96 h (day 4; right panel) is shown. Error bars represent mean ±S.D. (d) Immunophenotypically defined HSC (LinSca1+KIT+CD48CD150+) were sorted and infected with Plcγ1 shRNA or control shRNA. 500 GFP+ HSCs were injected along with 2.5 × 10⁵ supporter cells (whole BM) into lethally irradiated recipient mice. Twenty weeks after transplant, the mice were killed and BM was evaluated for erythroid lineage development; for flow cytometry analysis cells were labeled with antibodies against TER119 and CD44. For each group, five mice were analyzed; error bars represent mean ±S.D. (n=5)
Figure 5
Figure 5
Plcγ1 knockdown influences gene expression and modulates DNA methylation in I/11 erythroid progenitors. (a) Heatmap representation of the expression of most significantly upregulated (red) and downregulated (blue) genes in Plcγ1-deficient I/11 cells (Plcγ1 shRNA1, shRNA2) compared with control cells (scr). Fluorescence ratios were normalized by applying the Robust Multiarray Averaging analyses, we only included probe sets (n=10 078) whose expression varied as previously determined (genes with a log intensity variation of P>0.01 were excluded). (a) 0 h, (b) 6 h, (c) 12 h, (d) 22 h. H2afy2 is labeled with a red arrow. (b) Heatmap representation of the technical validation of 17 selected DMRs identified in our DNA methylation screening. The selection was done for log2FC of methylation enrichment and for potential biological interest of the genes. DNA methylation was measured using the MassArray technology. Each row represents a single CpG-unit. H2afy2 is highlighted with a red arrow. (c) The overlap of differentially expressed genes with DMRs revealed nine common targets. H2afy2 (highlighted in red) was the single common target among the top significantly upregulated and downregulated genes depicted in Figure 5a that showed a DMR. (d) Quantitative real-time PCR of H2afy2 expression in Plcγ1-deficient I/11 cells 22 h after differentiation. Each experiment (n=3) was done in triplicate and the error bars represent mean±S.E.M. (e) Quantitative analysis (paired t-test, two-tailed) of methylation changes as measured by MassArray for H2afy2
Figure 6
Figure 6
Macrohistone mH2A2 is regulated by Plcγ1 and is involved in erythroid differentiation. (a) Quantitative RT-PCR of H2afy2 mRNA in I/11 cells after infection with either mH2A2 shRNA or control shRNA. Each experiment (n=3) was done in triplicate and the error bars represent mean ±S.D. (b) Differentiation of I/11 cells stably infected with either mH2A2 shRNAs or control shRNA was measured for 96 h (day 4) in response to Epo. A representative FACS blot (left panel) and percentage of immature (TER119+CD44high) cells after 96 h (day 4; right panel) is shown. The error bars represent mean ±S.D. (n=4). (c) Representative cytospin analysis followed by Giemsa staining of mH2A2-deficient and control cells induced to differentiate in response to Epo. The scale bar represents 5 μm. (d) Survival of I/11 cells stably infected with either mH2A2 shRNA or control shRNA using Annexin V/SYTOX Blue staining. The error bars represent mean ±S.D. (n=3)

References

    1. Richmond TD, Chohan M, Barber DL. Turning cells red: signal transduction mediated by erythropoietin. Trends Cell Biol. 2005;15:146–155. - PubMed
    1. Paulson RF, Bernstein A. Receptor tyrosine kinases and the regulation of hematopoiesis. Semin Immunol. 1995;7:267–277. - PubMed
    1. Cantor AB, Orkin SH. Hematopoietic development: a balancing act. Curr Opin Genet Dev. 2001;11:513–519. - PubMed
    1. Wu H, Liu X, Jaenisch R, Lodish HF. Generation of committed erythroid BFU-E and CFU-E progenitors does not require erythropoietin or the erythropoietin receptor. Cell. 1995;83:59–67. - PubMed
    1. Grebien F, Kerenyi MA, Kovacic B, Kolbe T, Becker V, Dolznig H, et al. Stat5 activation enables erythropoiesis in the absence of EpoR and Jak2. Blood. 2008;111:4511–4522. - PMC - PubMed

Publication types

MeSH terms