. 2014 Nov 14;16(6):473.
doi: 10.1186/s13058-014-0473-z.

MiR-183/-96/-182 cluster is up-regulated in most breast cancers and increases cell proliferation and migration

MiR-183/-96/-182 cluster is up-regulated in most breast cancers and increases cell proliferation and migration

Pei Li et al. Breast Cancer Res. .

Abstract

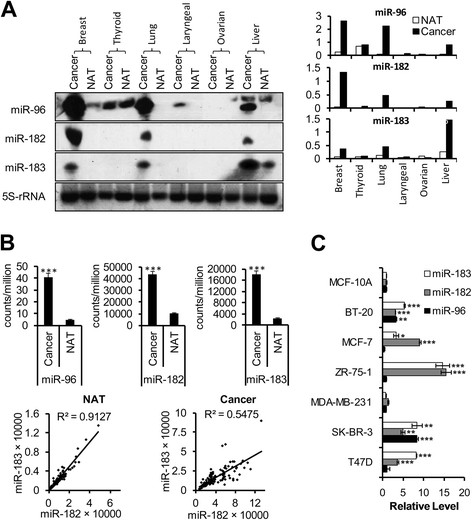
Introduction: The miR-183/-96/-182 cluster is a conserved polycistronic microRNA (miRNA) cluster which is highly expressed in most breast cancers. Although there are some sporadic reports which demonstrate the importance of each miRNA in this cluster in breast cancer, the biological roles of this cluster as a whole and its regulation mechanisms in breast cancer are still unclear. We compared the expression of this cluster in different cancer types, analyzed the regulation mechanism of this cluster, identified new target genes, and examined the impact of this cluster on breast cancer cells.

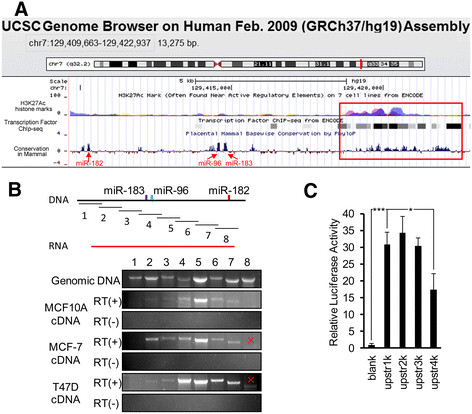
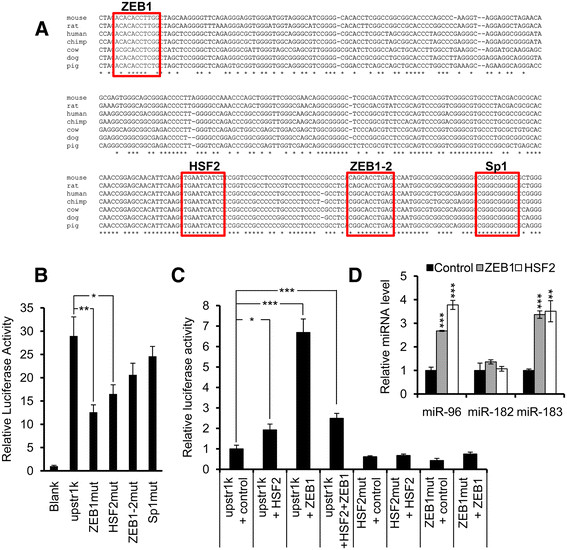
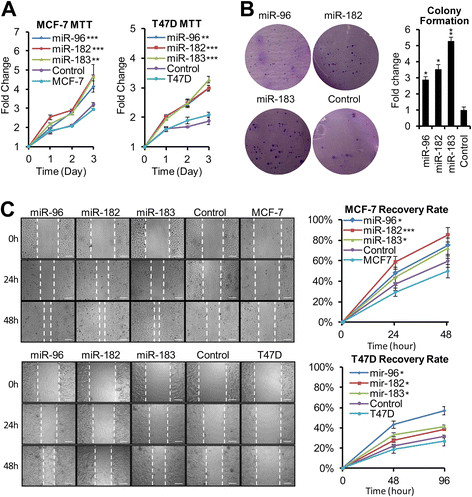
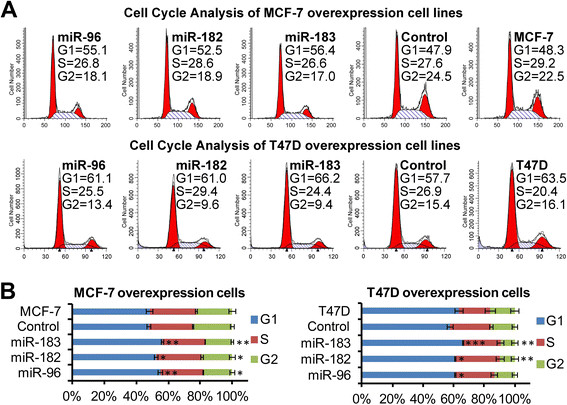
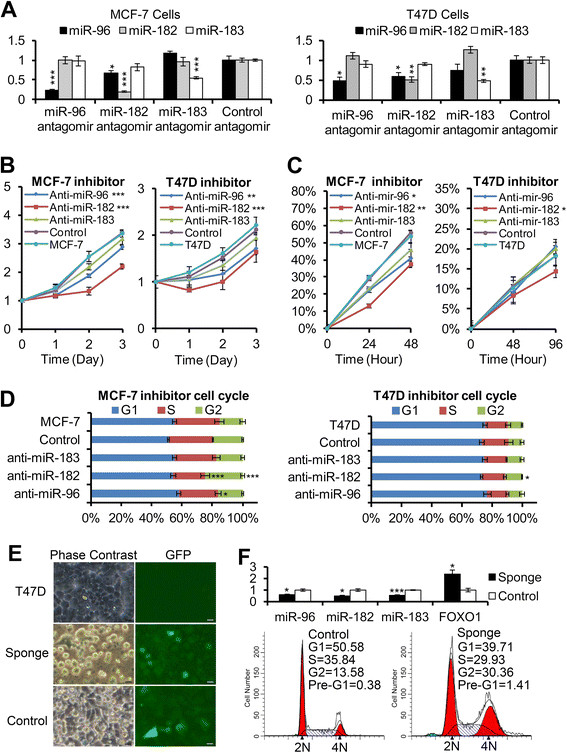
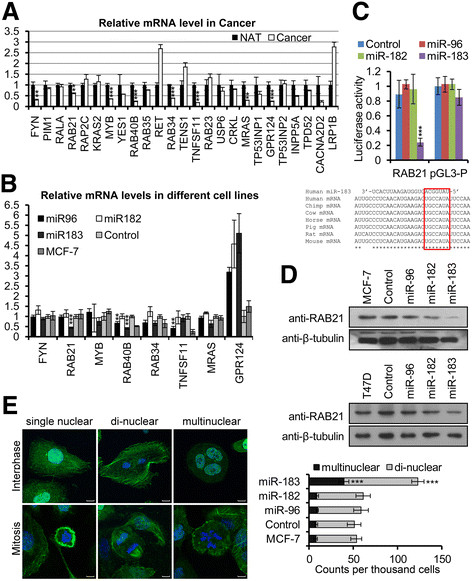
Methods: The miRNA level was detected by LNA-based northern blot and Real-time PCR, and was also analyzed from TCGA dataset. Bioinformatics research and luciferase assay were applied to find the promoter regions and transcription factors. To investigate the biological effects of the miR-183/-96 /-182 cluster in breast cancer, we generated miR-96, miR-182 and miR-183 overexpression stable cell lines to check the overdose effects; we also used miR-Down™ antagomir for each miRNA as well as miR-183/-96 /-182 cluster sponge lentivirus to check the knockdown effects. Growth, migration, cell cycle profile and survival of these cells was then monitored by colony formation assay, MTT assay, cell wound healing assay, flow cytometry and microscopy. The target gene was validated by Real-time PCR, luciferase assay, Western blot and Phalloidin/DAPI counterstaining.

Results: The miR-183/-96/-182 cluster was highly expressed in most breast cancers, and its transcription is disordered in breast cancer. The miR-183/-96/-182 cluster was transcribed in the same pri-miRNA and its transcription was regulated by ZEB1 and HSF2. It increased breast cell growth by promoting more rapid completion of mitosis, promoted cell migration and was essential for cell survival. MiR-183 targeted the RAB21 mRNA directly in breast cancer.

Conclusion: The miR-183/-96/-182 cluster is up-regulated in most breast cancer. It functions as an oncogene in breast cancer as it increases cell proliferation and migration.


Figures

Figure 1
Figure 1
MiR-183/-96/-182 cluster is highly expressed in breast cancer cells. (A) Detection of miR-183/-96/-182 cluster miRNAs by LNA-based northern blot in different cancer samples and their normal adjacent tissues (NAT). Left panel shows the northern blot analysis of miR-183/-96/-182 cluster miRNAs; 5S-r RNA was used as an internal control. Left panel is the quantification of selected miRNAs by the Image J program. The results were normalized to the 5S-r RNA. (B) Statistical analysis of miRNA expression data in breast invasive carcinoma from the TCGA dataset: upper panel compares the miRNA expression levels between tumor samples and their matched normal samples; lower panel analyzes the correlation between miR-182 and miR-183 levels in normal and tumor samples. Error bars indicate SD (n = 102). (C) Quantification of the miR-183/-96/-182 cluster miRNAs by real-time PCR in different breast cancer cell lines. MCF-10A cell was used as control. U6 snRNA was used as internal control. Error bars indicate SD (n = 3).
Figure 2
Figure 2
Analysis of the miR-183/-96/-182 cluster promoter region. (A) ENCODE project analysis of the upstream sequence of the miR-183/-96/-182 cluster: sequences in the red box represent the region from 5054 bp to 9324 bp upstream of the human miR-183 precursor that is highly conserved and enriched for 3K27Ac histone marks. (B) Fragmental reverse transcription (RT)-PCR demonstrated that the miR-183/-96/-182 cluster was transcribed in the same pri-miRNA: upper panel shows a schematic representation of the location of RT-PCR fragments and the miR-183/-96/-182 cluster in chromosome; lower panel shows the RT-PCR results of MCF-10A, MCF-7 and T47D cell cDNAs. Genomic DNA of MCF-7 cell was used as a positive control to check the efficiency of primer pairs; RNA sample, which did not undergo the reverse transcription reaction, was used as a negative control. (C) Luciferase assay indicated that most active regulatory elements were located within 1 kb from upstream of the TSS region of miR-183/-96/-182 cluster. All luciferase activities were normalized to those obtained with the pGL3-Basic vector alone. Error bars represent SD (n = 4).
Figure 3
Figure 3
Identification of the transcription factors regulating the miR-183/-96/-182 cluster. (A) Phylogenetic analysis demonstrated that there were four conserved transcription factor binding sites located within the 1 kb region upstream of the TSS of the miR-183/-96/-182 cluster in vertebrates. (B) Luciferase activities were decreased after mutation of the first ZEB1 and HSF2 transcription factor binding sites. All luciferase activities were normalized to those obtained with the pGL3-Basic vector alone. Error bars represent SD (n = 3). (C) Transfection of ZEB1 and HSF2 transcription factors could elevate the luciferase activity of native upstream 1 kb luciferase reporter but not its mutants. All luciferase activities were normalized to those obtained with the native upstream 1 kb alone. Error bars represent standard deviation (n = 3). (D) Real-time PCR showing that miR-96 and miR-183 levels were increased in ZEB1 and HSF2 overexpressing MCF-7 cell lines. U6 snRNA was used as internal control. Error bars represent SD (n = 3).
Figure 4
Figure 4
Up-regulation of the miR-183/-96/-182 cluster increased cell proliferation and migration. (A) The 3-(4, 5-dimethyl-2-thiazolyl)-2, 5-diphenyl-2H-tetrazolium bromide (MTT) assays showed that miR-183/-96/-182 cluster overexpression cell lines proliferated more rapidly than the vector control and non-infected cells. Error bars represent SD (n = 4). (B) Micrographs (left) and quantification (right) of crystal violet-stained cell colonies in miR-183/-96/-182 cluster overexpression MCF-7 cell lines and the vector control cells. Error bars represent SD (n = 4). (C) Cell wound-healing assays demonstrated that the migration abilities of overexpression cell lines were elevated: left panel, representative micrographs; right panel, quantification graph; upper panel, MCF-7 cells; lower panel, T47D cells. Error bars represent SD (n = 4). Scale bars: 100 μM.
Figure 5
Figure 5
Up-regulation of miR-183/-96/-182 cluster miRNAs changed the cell cycle profile. Flow cytometric analysis showed a significant decrease in the percentage of cells in the G2/M peak and an increase in the percentage of cells in the G1/G0 peak of miR-183/-96/-182 cluster overexpression cell lines compared with the vector control cells and non-infected cells. (A) Representative flow cytometric graph of each cell line. (B) Quantification graph of the flow cytometric analysis. Error bars represent SD (n = 3).
Figure 6
Figure 6
Inhibition of miR-183/-96/-182 cluster miRNAs decreased cell proliferation, and even induced cell death. (A) Real-time PCR results showed the knockdown efficiency and specificity of miR-Down™ antagomirs: left panel, MCF-7 cells; right panel, T47D cells. U6 snRNA was used as internal control. Error bars represent SD (n = 4). (B) The 3-(4, 5-dimethyl-2-thiazolyl)-2, 5-diphenyl-2H-tetrazolium bromide (MTT) assays showed the cell growth rates of miR-183/-96/-182 cluster knockdown cells. Error bars represent SD (n = 4). (C) Cell wound-healing assays showed the migration abilities of miR-183/-96/-182 cluster knockdown cells. Error bars represent SD (n = 4). (D) Flow cytometric analysis of miR-183/-96/-182 cluster knockdown cells. Error bars represent SD (n = 3). (E) T47D cells infected with miR-183/-96/-182 cluster sponge lentivirus underwent apoptosis 3 days after transduction: left panels, phase-contrast micrographs of indicated cells; right panels, green fluorescent micrographs of indicated cells. Scale bars: 20 μM. (F) Analysis of miR-183/-96/-182 cluster sponge lentivirus-infected T47D cells: upper panel, inhibition efficiency of miR-183/-96/-182 cluster sponge lentivirus shown by real-time PCR (error bars represent SD, n = 4; lower panels, flow cytometric graph of indicated cells.
Figure 7
Figure 7
Identification of candidate targets of miR-183/-96/-182 cluster miRNAs. Predicted miR-183/-96/-182 targets are listed in Additional file 4: Table S2 where their NCBI reference sequence, putative binding miRs and detection primers are also provided. (A) Comparison of candidate target mRNA levels between breast cancer samples and their normal adjacent tissue (NAT) by real-time PCR; glyceraldehyde-3-phosphate dehydrogenase (GAPDH) was used as an internal control. Error bars represent SD (n = 3). (B) Confirmation of target genes by real-time PCR in miR-183/-96/-182 cluster overexpression stable MCF-7 cell lines and control cells; GAPDH was used as an internal control. Error bars represent SD (n = 3). (C) Confirmation of miR-183/-96/-182 cluster targets by luciferase assay. All data were normalized to those obtained with the pGL3-Promoter vector alone. Error bars represent SD (n = 3): lower panel, sequences of miR-183 and its target sequences in the 3'-UTR of different species. (D) Protein levels of RAB21 in stable cell lines were documented by western blot with an anti-RAB21 antibody. β-Tubulin was used as the internal control; upper panel, MCF-7 cells; lower panel, T47D cells. (E) Phalloidin and 4',6-diamidino-2-phenylindole (DAPI) counterstaining results showed that the bi- and multinuclear cells were accumulated in miR-183 over-expressed MCF-7 cells; left panels, representative micrographs of single, bi- and multinuclear cells in both interphase and mitosis; right panel, quantification of bi- and multinuclear cells in different cell lines. Error bars represent SD (n = 5). Scale bars: 10 μM.

References

    1. Xu S, Witmer PD, Lumayag S, Kovacs B, Valle D. MicroRNA (miRNA) transcriptome of mouse retina and identification of a sensory organ-specific miRNA cluster. J Biol Chem. 2007;282:25053–25066. doi: 10.1074/jbc.M700501200. - DOI - PubMed
    1. Xu D, He X, Chang Y, Xu C, Jiang X, Sun S, Lin J. Inhibition of miR-96 expression reduces cell proliferation and clonogenicity of HepG2 hepatoma cells. Oncol Rep. 2013;29:653–661. - PubMed
    1. Mihelich BL, Khramtsova EA, Arva N, Vaishnav A, Johnson DN, Giangreco AA, Martens-Uzunova E, Baqasra O, Kajdacsy-Balla A, Nonn L. miR-183–96–182 cluster is overexpressed in prostate tissue and regulates zinc homeostasis in prostate cells. J Biol Chem. 2011;286:44503–44511. doi: 10.1074/jbc.M111.262915. - DOI - PMC - PubMed
    1. Weeraratne SD, Amani V, Teider N, Pierre-Francois J, Winter D, Kye MJ, Senqupta S, Archer T, Remke M, Bai AH, Warren P, Pfister SM, Steen JA, Pomeroy SJ, Cho YJ. Pleiotropic effects of miR-183 ~ 96 ~ 182 converge to regulate cell survival, proliferation and migration in medulloblastoma. Acta Neuropathol. 2012;123:539–552. doi: 10.1007/s00401-012-0969-5. - DOI - PMC - PubMed
    1. Lin H, Dai T, Xiong H, Zhao X, Chen X, Yu C, Li J, Wang X, Song L. Unregulated miR-96 induces cell proliferation in human breast cancer by downregulating transcriptional factor FOXO3a. PLoS One. 2010;5:e15797. doi: 10.1371/journal.pone.0015797. - DOI - PMC - PubMed

Publication types