. 2015 Jun;22(6):561-70.
doi: 10.1111/jvh.12361. Epub 2014 Nov 14.

Genome-free hepatitis B virion levels in patient sera as a potential marker to monitor response to antiviral therapy

Affiliations

Genome-free hepatitis B virion levels in patient sera as a potential marker to monitor response to antiviral therapy

L Luckenbaugh et al. J Viral Hepat. 2015 Jun.

Abstract

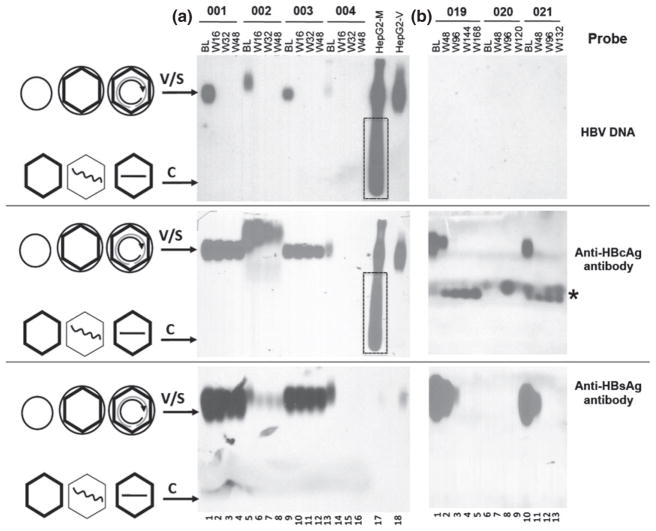
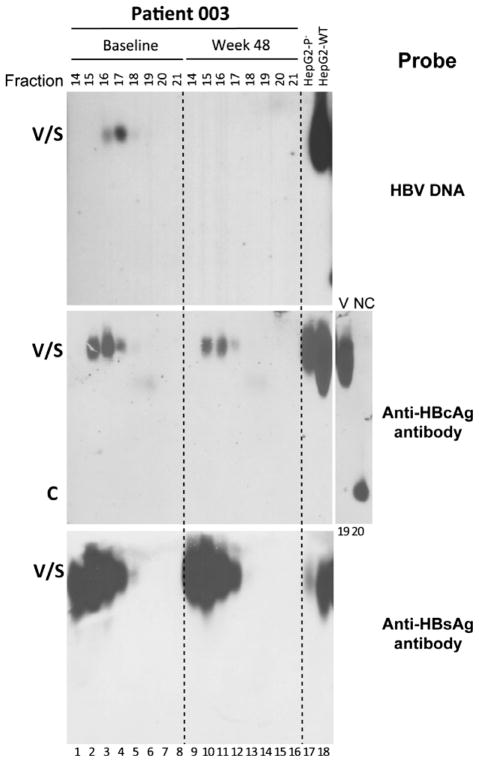
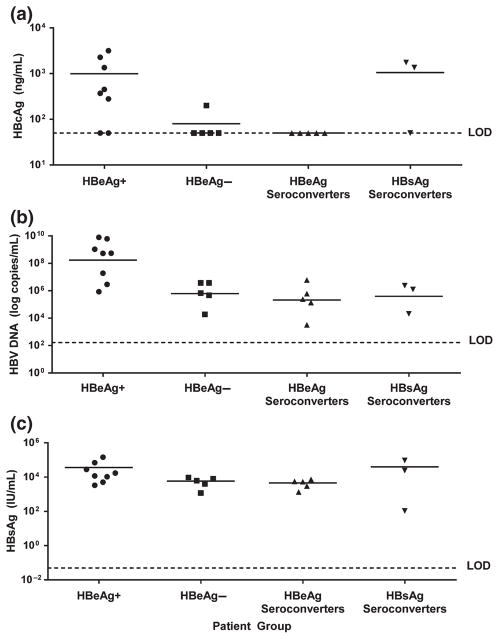
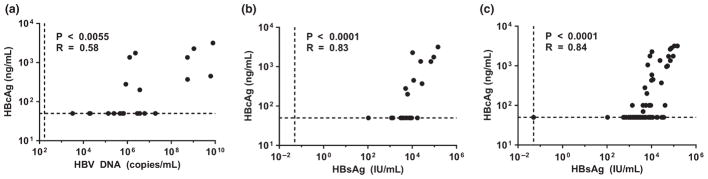
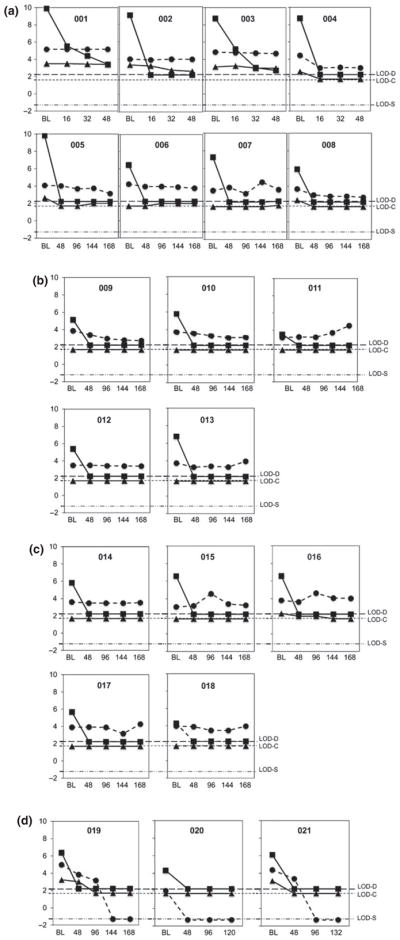
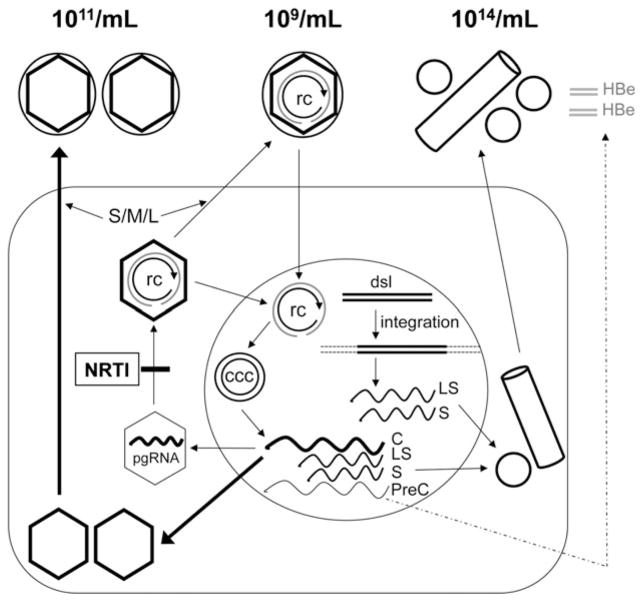
Complete virions of hepatitis B virus (HBV) contain a DNA genome that is enclosed in a capsid composed of the HBV core antigen (HBcAg), which is in turn surrounded by a lipid envelope studded with viral surface antigens (HBsAg). In addition, HBV-infected cells release subviral particles composed of HBsAg only (HBsAg 'spheres' and 'filaments') or HBsAg enveloping HBcAg but devoid of viral DNA ('empty virions'). The hepatitis B e antigen (HBeAg), a soluble antigen related to HBcAg, is also secreted in some HBV-infected patients. The goals of this study were to explore the levels of empty virions in HBV-infected patients before and during therapy with the nucleotide analog tenofovir disoproxil fumarate (TDF) that inhibits HBV DNA synthesis and the relationships of empty virions to complete virions, HBsAg and HBeAg. HBV DNA, HBcAg and HBsAg levels were determined in serum samples from 21 patients chronically infected with HBV and enrolled in clinical TDF studies. Serum levels of empty virions were found to exceed levels of DNA-containing virions, often by ≥ 100-fold. Levels of both empty and complete virions varied and were related to the HBeAg status. When HBV DNA replication was suppressed by TDF, empty virion levels remained unchanged in most but were decreased (to the limit of detection) in some patients who also experienced significant decrease or loss of serum HBsAg. In conclusion, empty virions are present in the serum of chronic hepatitis B patients at high levels and may be useful in monitoring response to antiviral therapy.

Keywords: cccDNA; empty hepatitis B virion; hepatitis B core antigen; hepatitis B e antigen; nucleotide analog.


Figures

Fig. 1
Fig. 1
Analysis of complete and empty HBV virions by native agarose gel electrophoresis. Serum samples (5 μL/well) from four HBeAg+ patients who remained HBeAg+ during TDF therapy (a) and three who experienced HBeAg and HBsAg loss during TDF therapy (b) were resolved on native agarose gels and detected following Southern blot transfer using a 32P-labelled HBV DNA probe to detect the virion-associated DNA genome (rcDNA-containing virions; top row), an HBc-specific antibody to detect virion-associated capsids (rcDNA-containing and empty virions; middle row) and an HBsAg-specific antibody to detect envelope proteins associated with virions as well as HBsAg spheres and filaments (bottom row). Patient numbers are indicated on the top, as are the time points evaluated: baseline (BL) and the indicated weeks (W) after starting TDF-containing therapy. HBV virions and naked NCs concentrated from the culture supernatant of HBV-transfected hepatoma (HepG2) cells (medium or M, lane 17) and HBV virions (10 ng of virion capsid protein) purified by CsCl density gradient fractionation from the supernatant (virion or V, lane 18) were loaded in parallel. The boxes in lane 17 denote the naked NCs present in the supernatant that were removed by the gradient fractionation. The * symbol denotes unknown cross-reacting materials in the serum samples. The diagrams on the left depict schematically the complete or empty virions (V, large circles (envelope) with an inner diamond shell (capsid), with or without rcDNA inside, respectively), HBsAg spheres (S, small circle; HBsAg filaments omitted for brevity), empty and single-stranded DNA (straight line) or viral RNA (wavy line) containing naked (nonenveloped) capsids (C, hexagonal shells).
Fig. 2
Fig. 2
Analysis of HBV virions in human sera by CsCl density gradient fractionation. Two serum samples, at baseline (lanes 1–8) and week 48 (lanes 9–16) post-treatment, from patient 003 were fractionated by CsCl gradient centrifugation. The indicated fractions were resolved on a native agarose gel. HBV DNA, HBcAg and HBsAg were detected as described in Fig. 1. HBV virions purified from culture supernatant of HepG2 cells transfected with wild-type (WT; lane 18) HBV DNA or a mutant defective in polymerase expression (P; lane 17) were included as controls. A virion (V) and naked capsid (NC) fraction harvested from the wild-type HBV-transfected HepG2 cell supernatant by CsCl gradient fractionation were loaded respectively in lanes 19 and 20 to show the migration of naked capsids relative to virions. Other labels are the same as in Fig. 1.
Fig. 3
Fig. 3
Distribution of serum HBcAg, serum HBV DNA and serum HBsAg levels in patients in relation to HBeAg status. Baseline (pre-TDF treatment) levels of serum HBcAg (Western Blot) (a), serum HBV DNA (COBAS TaqMan PCR) (b) and serum HBsAg (Architect HBsAg quantitative assay) (c) are plotted for each patient. Patients are grouped by HBeAg status: first column, 8 HBeAg+ patients that remained HBeAg+ on treatment; second column, 5 HBeAg− patients who remained HBeAg− on treatment but did not lose HBsAg; third column, 5 HBeAg+ patients who lost HBeAg on therapy, but who did not lose HBsAg; fourth column, 3 HBeAg+ patients who lost both HBeAg and HBsAg on therapy. LOD, limit of detection.
Fig. 4
Fig. 4
Correlation of serum HBcAg levels to those of serum HBV DNA and serum HBsAg at baseline and during therapy. Serum HBcAg levels (Western blot) plotted against serum HBV DNA levels (COBAS TaqMan PCR) at baseline (pre-TDF therapy) (a). Serum HBcAg levels plotted against serum HBsAg levels (Architect HBsAg quantitative assay) at baseline (b). Serum HBcAg levels plotted against serum HBsAg levels at baseline (n = 21) and during TDF therapy (n = 99) (c). Limits of detection are indicated by vertical and horizontal dotted lines. Two-tailed P values and R values (Pearson correlation coefficient test) are indicated.
Fig. 5
Fig. 5
HBV DNA, HBcAg and HBsAg levels at baseline and during TDF therapy. Patients are grouped based on HBeAg status: HBeAg+ (a), HBeAg loss on TDF (b), HBeAg− pre-TDF therapy (c), and HBeAg and HBsAg loss on TDF therapy (d). Patient numbers and time points of serum collection (BL, baseline; and weeks after the start of therapy) are indicated. Y-axis values are Log10: DNA in copies/mL (squares), HBcAg in ng/mL (triangles) and HBsAg in IU/mL (circles). Dashed lines show limits of detection (LOD) for viral DNA (D), HBcAg (C) and HBsAg (S). Time points of HBeAg loss were weeks 120, 84, 96, 108 and 120 for patients 009–013, respectively (b), and weeks 108, 48 and 84 for patients 019–021, respectively (d).
Fig. 6
Fig. 6
Secretion of DNA-containing and empty virions, HBsAg spheres and filaments, and HBeAg during HBV replication and effects of antiviral therapy. The various particles are depicted as in Fig. 1, with their approximate titres indicated. The HBsAg filament is depicted as a cylinder. The soluble, dimeric HBeAg is depicted as grey double bars. The dashed arrow denotes the fact that HBeAg is not always secreted during viral replication. The wavy lines denote the viral RNAs: C, mRNA for HBc (and pgRNA); S and LS, mRNAs for HBsAg; PreC, mRNA for HBeAg. S/M/L, the small, middle and large envelope protein; NRTI, nucleoside analog RT inhibitor; rc, rcDNA; ccc, cccDNA; dsl, double-stranded linear DNA. See text for details.

References

    1. Seeger C, Zoulim F, Mason WS. Hepadnaviruses. In: Knipe DM, Howley PM, editors. Fields Virology. Philadelphia: Lippincott, Williams & Wilkins; 2007. pp. 2977–3030.
    1. Summers J, O’Connell A, Millman I. Genome of hepatitis B virus: restriction enzyme cleavage and structure of DNA extracted from Dane particles. Proc Natl Acad Sci USA. 1975;72:4597–4601. - PMC - PubMed
    1. Summers J, Mason WS. Replication of the genome of a hepatitis B–like virus by reverse transcription of an RNA intermediate. Cell. 1982;29(2):403–415. - PubMed
    1. Conway JF, Cheng N, Zlotnick A, Wingfield PT, Stahl SJ, Steven AC. Visualization of a 4-helix bundle in the hepatitis B virus capsid by cryo-electron microscopy. Nature. 1997;386(6620):91–94. - PubMed
    1. Wynne SA, Crowther RA, Leslie AG. The crystal structure of the human hepatitis B virus capsid. Mol Cell. 1999;3(6):771–780. - PubMed

Publication types