. 2014 Nov 14;346(6211):1256442.
doi: 10.1126/science.1256442.

DNA recombination. Recombination initiation maps of individual human genomes

Affiliations

DNA recombination. Recombination initiation maps of individual human genomes

Florencia Pratto et al. Science. .

Erratum in

Abstract

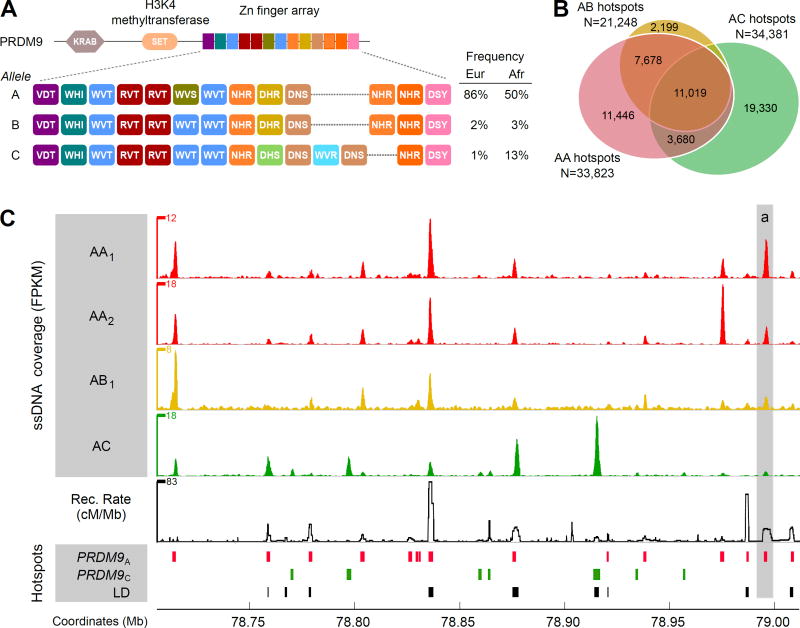
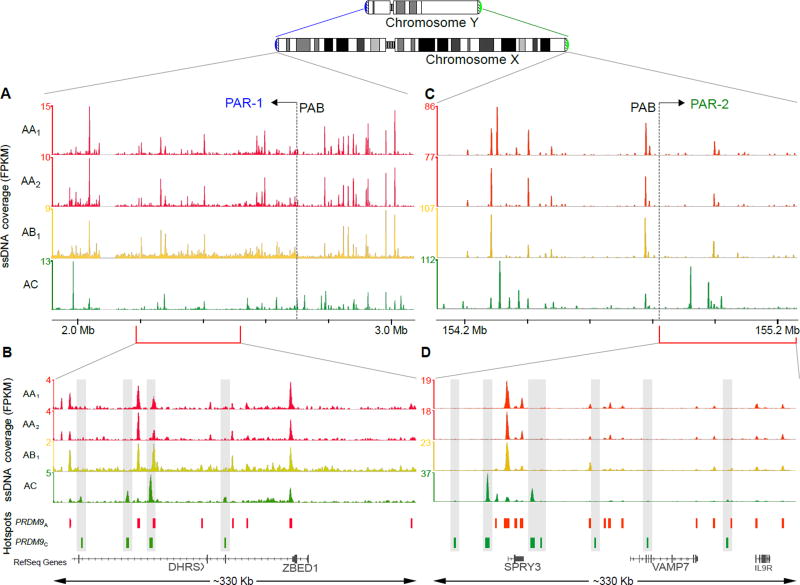
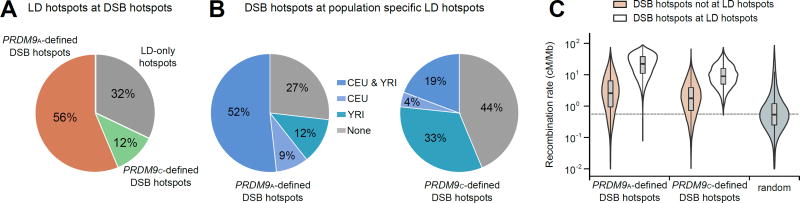
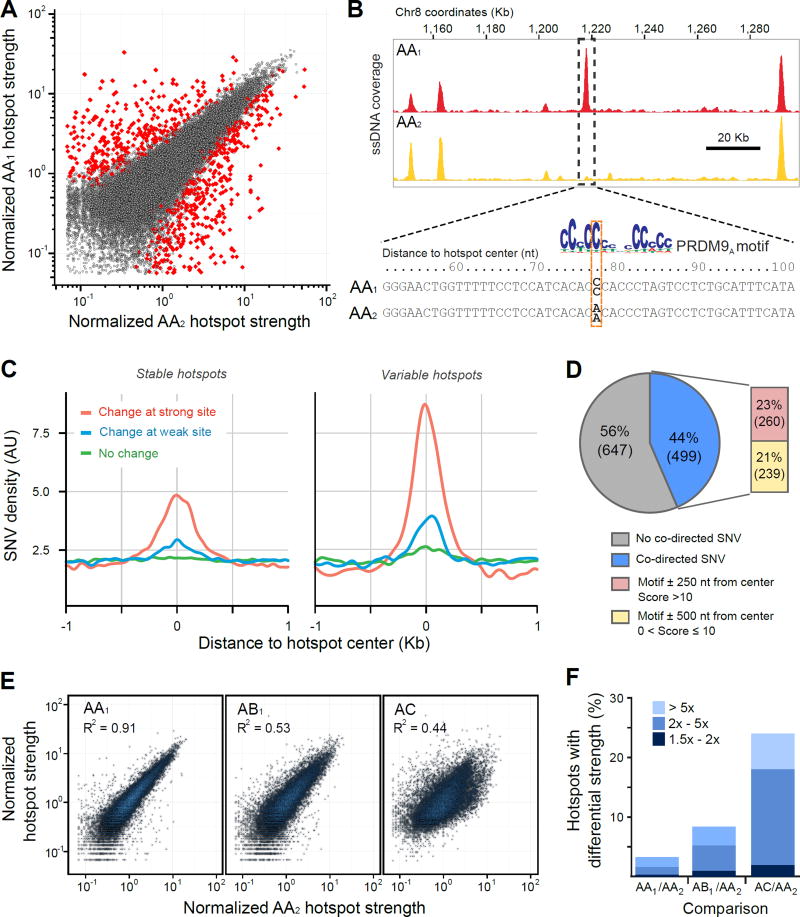
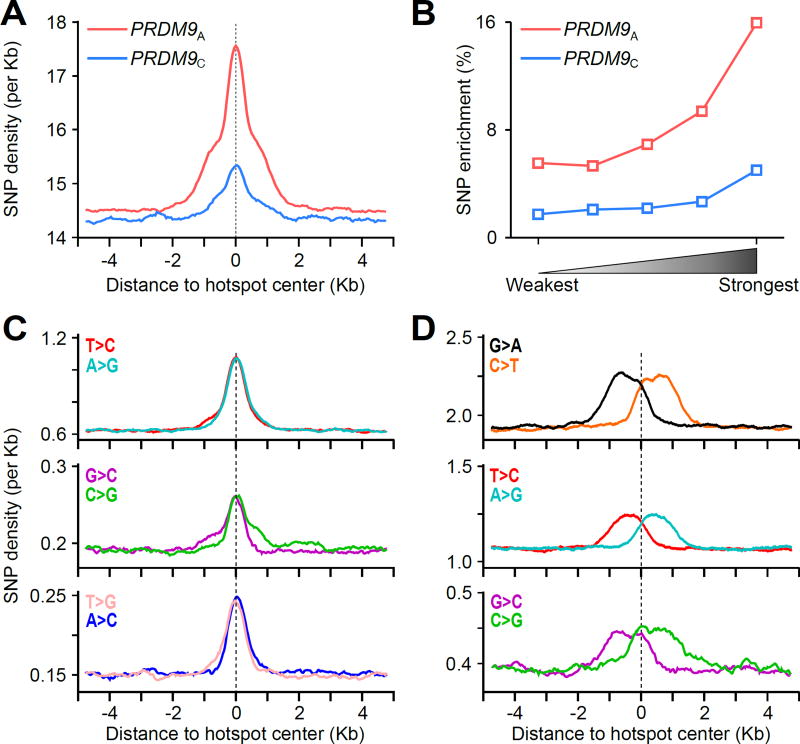
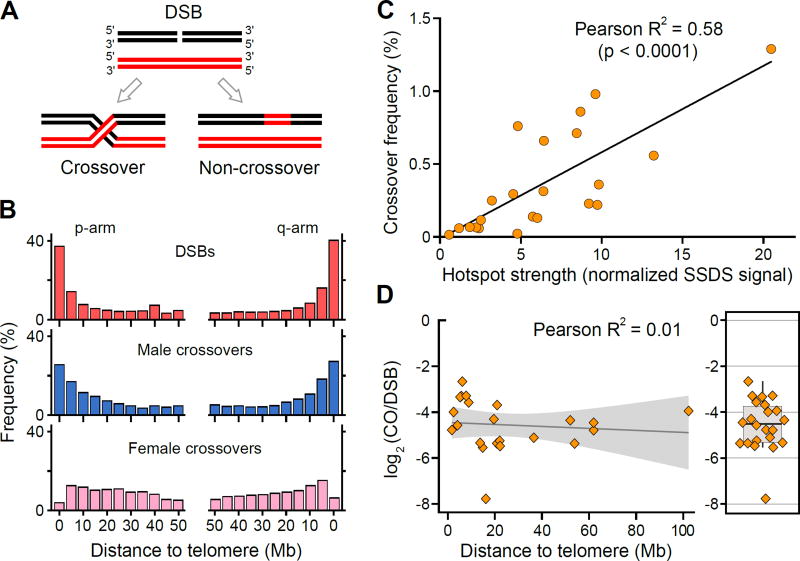
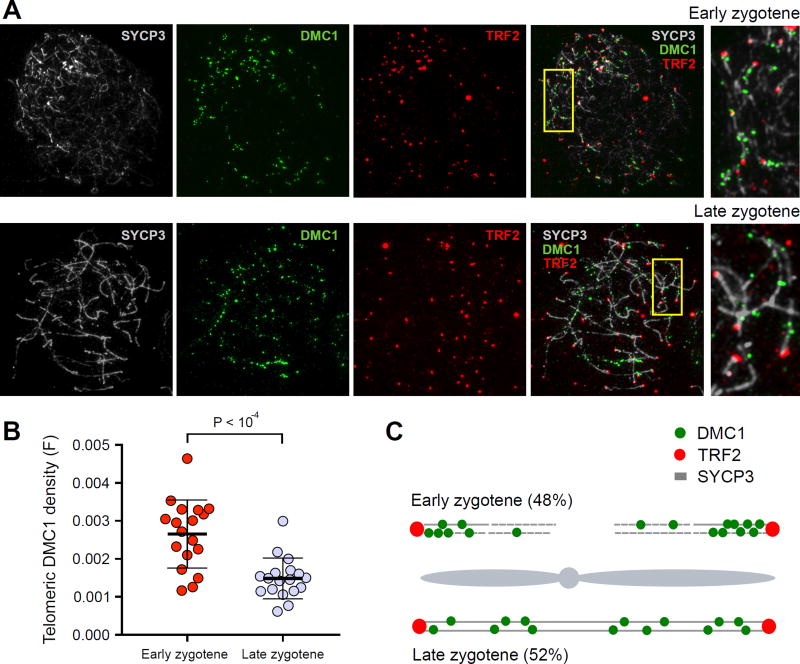
DNA double-strand breaks (DSBs) are introduced in meiosis to initiate recombination and generate crossovers, the reciprocal exchanges of genetic material between parental chromosomes. Here, we present high-resolution maps of meiotic DSBs in individual human genomes. Comparing DSB maps between individuals shows that along with DNA binding by PRDM9, additional factors may dictate the efficiency of DSB formation. We find evidence for both GC-biased gene conversion and mutagenesis around meiotic DSB hotspots, while frequent colocalization of DSB hotspots with chromosome rearrangement breakpoints implicates the aberrant repair of meiotic DSBs in genomic disorders. Furthermore, our data indicate that DSB frequency is a major determinant of crossover rate. These maps provide new insights into the regulation of meiotic recombination and the impact of meiotic recombination on genome function.


Figures

Figure 1
Figure 1. Genome-wide distribution of DSB hotspots in human individuals
(A) Zn finger array structure of PRDM9 alleles in individuals from this study. Population allele frequencies are taken from (9). (B) The overlap between autosomal hotspots found in different individuals. AA hotspots are the hotspots found in either AA1 or AA2 individuals. (C) DSB hotspots from AA1, AA2, AB1 and AC individuals in a 300 Kb region on chromosome 17. The top four panels show normalized ssDNA coverage in fragments per Kb per million (FPKM), smoothed using a sliding window (window: 1 Kb; step: 0.1 Kb). The baseline of the y-axes is 0 FPKM. The fifth panel shows the recombination rate calculated from the population-averaged HapMap data (15). The lower panels show PRDM9A- and PRDM9C-defined DSB hotspots and LD-defined hotspots.
Figure 2
Figure 2. PRDM9-defined hotspots are found in the human PARs
Overview of ~1 Mb regions on chromosome X overlapping the (A) PAR1 and (B) PAR2 pseudoautosomal boundaries (PABs). Normalized ssDNA coverage is shown as fragments per Kb per million (FPKM), smoothed using a sliding window (window: 1 Kb; step: 0.1 Kb). The baseline of the y-axes is 0 FPKM. Coverage is shown for the AA1, AA2, AB and AC individuals. Red and green bars depict PRDM9A-defined and PRDM9C-defined hotspots, respectively. Close up of a (C) 330 Kb region of the PAR1 and (D) the entire ~330 Kb PAR2 illustrating the presence of PRDM9C-defined hotspots (highlighted by grey bars) in both PARs.
Figure 3
Figure 3. Comparison of LD-based recombination maps and DSB hotspots
(A) The proportion of LD-hotspots that overlap PRDM9A- or PRDM9C-defined DSB hotspots. Most LD-hotspots are detected in the DSB hotspot maps. (B) The percentage of PRDM9A- (left) and PRDM9C-defined (right) hotspots overlapping LD-hotspots in the CEU (European) and YRI (African) populations. Most DSB hotspots are found in the LD maps. (C) Violin plots showing the population averaged recombination rate at DSB hotspots that overlap or do not overlap LD-hotspots defined in the CEU and YRI populations. 85% of PRDM9A-defined and 82% of PRDM9C-defined hotspots that do not overlap an LD-hotspot have a recombination rate above random expectation.
Figure 4
Figure 4. Variation in hotspot strength between the AA1 and AA2 individuals
(A) A comparison of PRDM9A-defined hotspot strength in the AA1 and AA2 individuals. Variable hotspots that satisfy our statistical criteria are shown in red. (B) Example of a variable hotspot between the two AA individuals where a homozygous SNV disrupts a PRDM9 motif near the hotspot center. The PRDM9 motif match is better in AA1 than in AA2 and the change in hotspot strength is co-directed with the change in motif score. (C) Motif-affecting SNVs are enriched around hotspot centers. The SNV density was smoothed using a gaussian kernel estimation and is shown for variants that change the motif score at a strong putative PRDM9 binding site (score > 10; red), at a weak putative PRDM9 binding site (0 < score ≤ 10; blue) or that do not change a putative binding site (green). Only changes > 1 bit are considered. Y-axis is expressed in arbitrary units (AU). Separate plots for stable (N=35,228; left) and for variable (N=1,146; right) hotspots from the AA1/AA2 comparison are shown. (D) The proportion of variable hotspots that contain a co-directed motif-affecting SNV near the hotspot centers. (E) PRDM9A-defined hotspot strength in the AA1, AB1 and AC individuals compared to the AA2 individual. Here, we used 15,051 PRDM9A-defined hotspots common to all four individuals. (F) Quantification of variable PRDM9A-defined hotspots between individuals. Bar colors indicate fold change.
Figure 5
Figure 5. Signatures of increased genetic diversity at DSB hotspots
(A) A local increase in SNP density is observed at both PRDM9A- (red) and PRDM9C-defined (blue) hotspots. All SNPs from the 1,000 genomes project were used. (B) The magnitude of SNP enrichment at hotspots is positively correlated with hotspot strength. SNP enrichment is calculated as the SNP density in the central ± 1.5 Kb relative to the mean SNP density in the region from 4 to 5 Kb from the hotspot center. (C) Common AT>GC and GC>CG variants are enriched in the ± 0.5 Kb region around the hotspot center. (D) Rare variants are enriched in a region ± 1.5 Kb around the hotspot center. Only variants enriched at hotspots are shown. Variants exhibit rotational symmetry around the hotspot center.
Figure 6
Figure 6. DSB frequency is correlated with the crossover rate
(A) Meiotic DSBs can be repaired as either a crossover or a non crossover. (B) The distribution of PRDM9A-defined DSBs from the AA2 individual (red) and broad scale distribution of male (blue) and female (pink) derived crossovers from (18). (C) The average DSB frequency from the two AA individuals is correlated with crossover frequency at 22 PRDM9A-defined hotspots (P < 10−4, two tailed t-test). Crossover frequency is taken from (9) and (32) (D) The CO:DSB ratio is not strongly dependent on the distance to the telomere. The CO:DSB ratio for each of the hotspots analyzed in (C) is plotted against the absolute distance of the hotspot to the closest telomere. The shaded region represents the standard error for the linear fit line. The boxplot (right) illustrates that the CO:DSB ratio is highly variable among individual hotspots.
Figure 7
Figure 7. Increased frequency of DSB formation near telomeres
(A) Early and late zygotene spermatocytes stained with SYCP3 (which detects axial elements) in grey, DMC1 (a marker of DSBs) in green, and TRF2 (a marker of telomeres) in red. DMC1 foci are clustered near telomeres at early zygotene. (B) Telomere-proximal DMC1 density is about 2-fold higher in early compared to late zygotene cells. For each cell, we manually traced all chromosome axes that unambiguously initiated at a TRF2 focus. We defined telomere-proximal regions as the 1μm of axis adjacent to the TRF2 focus (Fig. S30A). For each cell, the telomeric density of DMC1 foci (F) was calculated as ((Σ DMC1 foci in telomere proximal 1μm regions) / (total DMC1 foci) / (total TRF2 foci)). We do not count DMC1 foci adjacent to TRF2 foci that could not be unambiguously attributed to a particular chromosomal axis. This is particularly punitive for early cells as the DMC1 density appears highest in regions where TRF2 foci are clustered and individual axes are difficult to distinguish. Error bars indicate mean ± SD. P-values are calculated using a Mann-Whitney U-test. (C) Cartoon showing the distribution of DMC1 foci in early and late zygotene spermatocytes. 48% of zygotene cells are at the early stage where they show significantly higher frequency of DSB formation near telomeres. At late zygotene, DSBs are more evenly distributed. The combined signal from these two populations may result in the telomeric bias we observe in our genome-wide maps.

Comment in

References

    1. Baudat F, et al. PRDM9 is a major determinant of meiotic recombination hotspots in humans and mice. Science. 2010;327:836–840. - PMC - PubMed
    1. Parvanov ED, Petkov PM, Paigen K. Prdm9 controls activation of mammalian recombination hotspots. Science. 2010;327:835. - PMC - PubMed
    1. Myers S, et al. Drive against hotspot motifs in primates implicates the PRDM9 gene in meiotic recombination. Science. 2010;327:876–879. - PMC - PubMed
    1. Brick K, Smagulova F, Khil P, Camerini-Otero RD, Petukhova GV. Genetic recombination is directed away from functional genomic elements in mice. Nature. 2012;485:642–645. - PMC - PubMed
    1. Baudat F, Imai Y, de Massy B. Meiotic recombination in mammals: localization and regulation. Nat Rev Genet. 2013;14:794–806. - PubMed

Publication types

Substances

Associated data