. 2015 Jan 1;128(1):171-84.
doi: 10.1242/jcs.163659. Epub 2014 Nov 13.

Chromosome congression is promoted by CENP-Q- and CENP-E-dependent pathways

Affiliations

Chromosome congression is promoted by CENP-Q- and CENP-E-dependent pathways

James Bancroft et al. J Cell Sci. .

Abstract

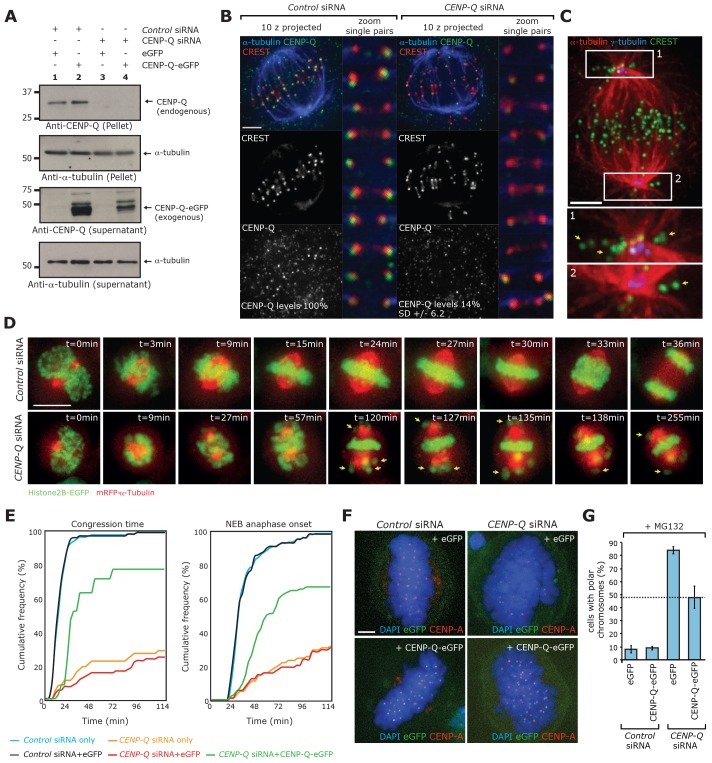
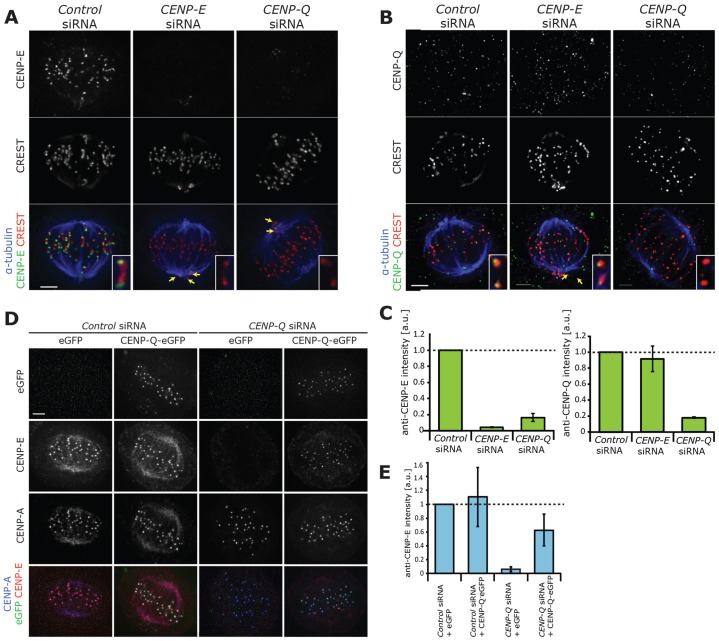
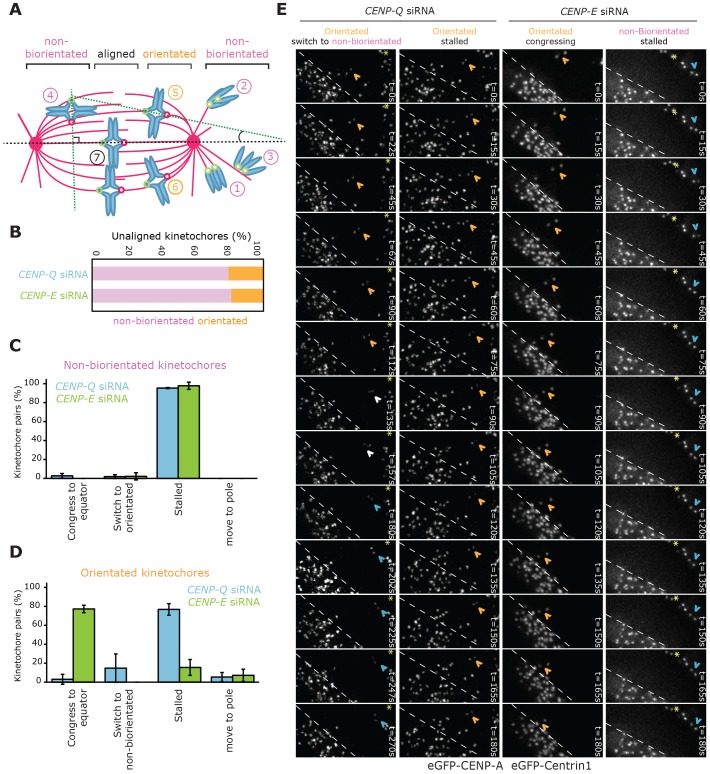
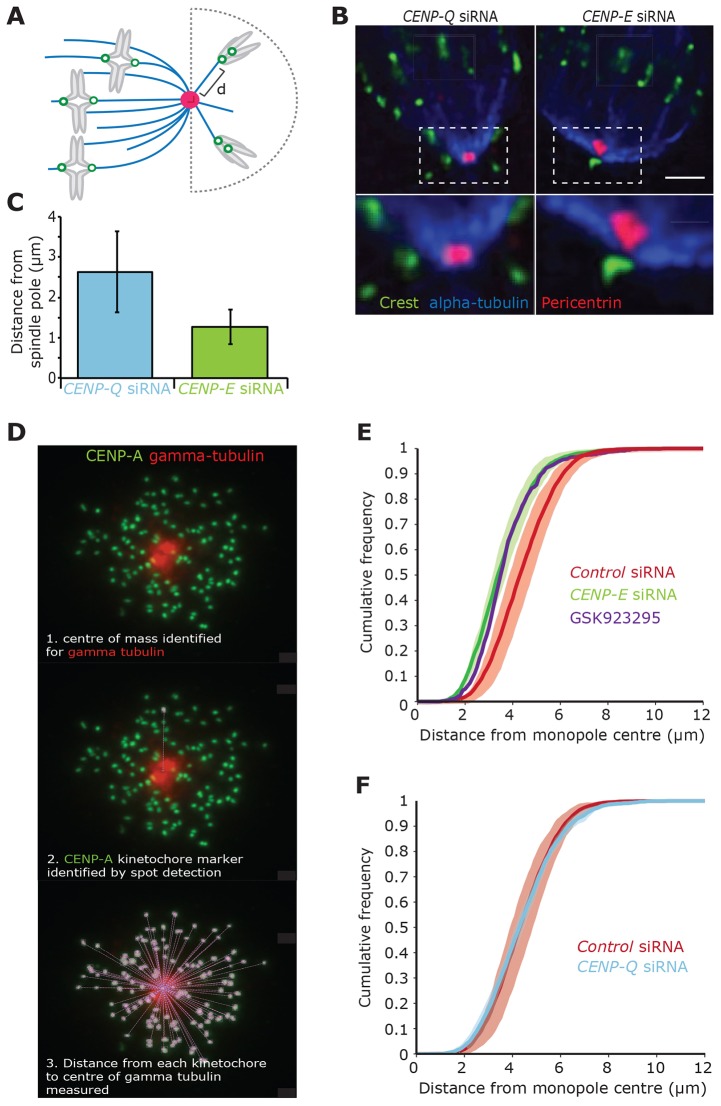
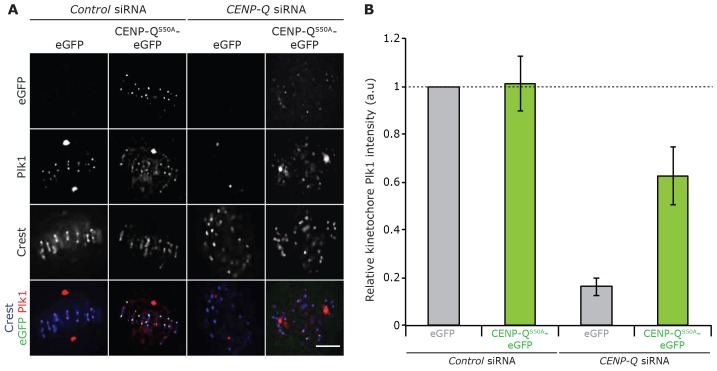
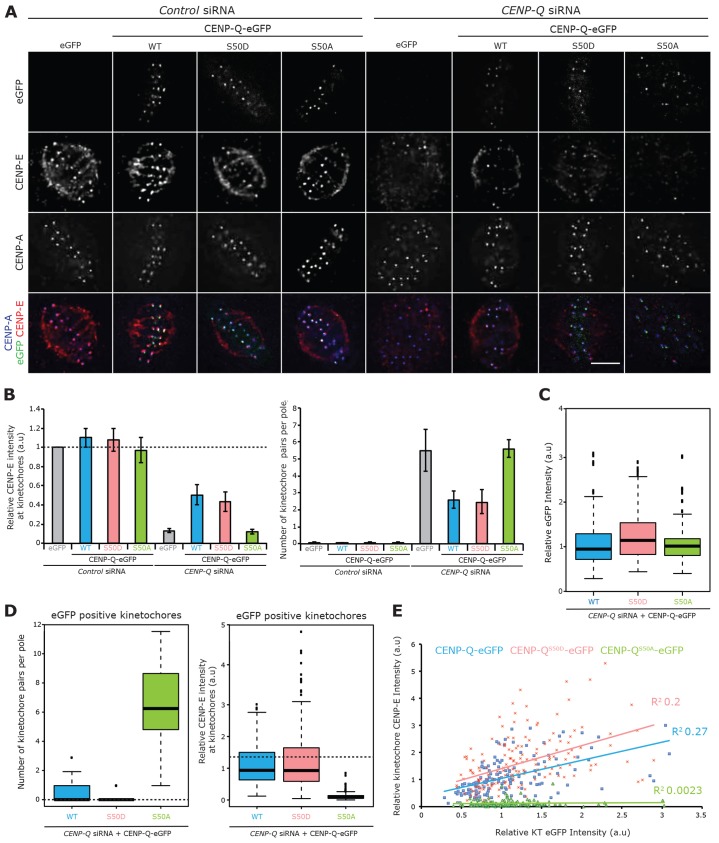
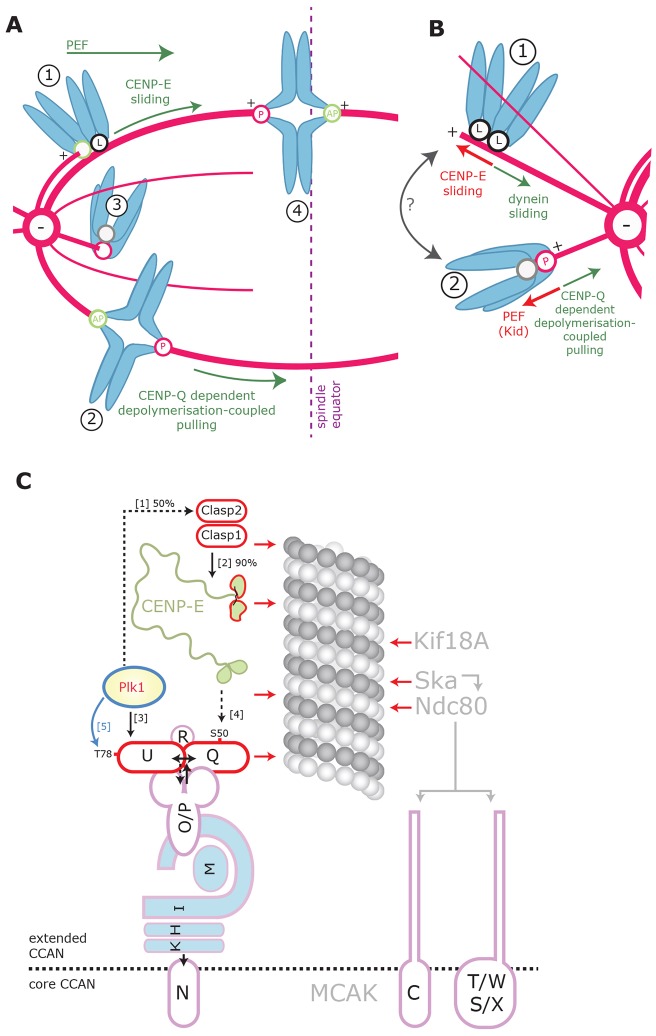
A key step of mitosis is the congression of chromosomes to the spindle equator. Congression is driven by at least two distinct mechanisms: (1) kinetochores slide along the microtubule lattice using the plus-end directed CENP-E motor, and (2) kinetochores biorientating near the pole move to the equator through microtubule depolymerisation-coupled pulling. Here, we show that CENP-Q - a subunit of the CENP-O complex (comprising CENP-O, CENP-P, CENP-Q and CENP-U) that targets polo-like kinase (Plk1) to kinetochores - is also required for the recruitment of CENP-E to kinetochores. We further reveal a CENP-E recruitment-independent role for CENP-Q in depolymerisation-coupled pulling. Both of these functions are abolished by a single point mutation in CENP-Q (S50A) - a residue that is phosphorylated in vivo. Importantly, the S50A mutant does not affect the loading of Plk1 onto kinetochores and leaves the CENP-O complex intact. Thus, the functions of CENP-Q in CENP-E loading and depolymerisation-coupled pulling are independent from its role in Plk1 recruitment and CENP-O complex stabilisation. Taken together, our data provide evidence that phosphoregulation of CENP-Q plays a central function in coordinating chromosome congression mechanisms.

Keywords: CENP-E; CENP-Q; Congression; Kinetochore; Mitosis.


Figures

Fig. 1.
Fig. 1.
Depletion of the outer-plate protein CENP-Q causes accumulation of polar chromosomes. (A) Immunoblots of whole-cell HeLa E1 lysates that had been transfected with control siRNA or an siRNA against CENP-Q (CENP-Q siRNA) for 12 h and then transfected with either empty vector or an siRNA-resistant vector expressing CENP-Q tagged with eGFP for 48 h. The blot was probed with antibodies against CENP-Q and α-tubulin. Endogenous CENP-Q and the corresponding α-tubulin control are shown in the top two panels. The pellet fraction is shown as nonspecific staining obscuring the protein in the supernatant. Expression of the transgene and corresponding α-tubulin loading control are shown in the lower two panels. (B) Immunofluorescence microscopy images of metaphase cells and magnified (zoom) kinetochore pairs in cells transfected with a control siRNA or CENP-Q siRNA that were then stained with CREST antisera (red) and antibodies against CENP-Q (green) and α-tubulin (blue). The images of metaphase cells correspond to z-projections (10 focal planes at 0.2 µm spacing) and the zoom images of the single kinetochores are from a single focal plane of the stack. Values at the base of the bottom two panels correspond to the relative values of CENP-Q staining in control and CENP-Q-depleted cells (n = 3, 150 kinetochores, 30 cells). (C) Immunofluorescence microscopy images of a CENP-Q-depleted metaphase HeLa E1 cell stained with CREST antisera (green) and an antibody against α-tubulin (red). The image is a z-projection (10 focal planes at 0.2 µm spacing). Zoom boxes 1 and 2 are centred on the spindle poles, and yellow arrows point to unaligned kinetochores around the spindle poles. (D) Frames from live-cell movies of HeLa E1 cells co-expressing H2B–eGFP and mRFP–α-tubulin in control (top row) and CENP-Q-siRNA-treated cells (second row). Yellow arrows point to unaligned kinetochores. Videos of control and CENP-Q-depleted cells are available in in supplementary material Movies 1 and 2, respectively. t = 0, point of nuclear envelope breakdown. (E) Quantification of the time from nuclear envelope breakdown (NEB) to the time when the last chromosome congressed to the metaphase plate, and NEB to the time of anaphase onset. Blue and orange lines indicate the timings of HeLa E1 cells co-expressing H2B–eGFP and mRFP–α-tubulin in control and CENP-Q-siRNA-treated cells, respectively. Black green and red lines represent timing data from cells expressing H2B–mRFP that had been treated with control siRNA and siRNA-resistant CENP-Q–eGFP vector (black), CENP-Q siRNA and siRNA-resistant CENP-Q–eGFP vector (green) and CENP-Q siRNA and eGFP vector (red). (F) Immunofluorescence microscopy images (z-projections, 10 focal planes at 0.2 µm spacing) of a CENP-Q-siRNA rescue experiment in HeLa E1 cells. Cells were treated with CENP-Q siRNA or control siRNA for 14 h and then transfected with an siRNA-resistant CENP-Q–eGFP construct or a control eGFP expression plasmid for a further 48 h. To reduce the effect of the mitotic stage on alignment, cells were treated with 1 µM MG132 for 90 min before fixation. Cells were stained with DAPI and probed with an antibody against CENP-A. (G) Quantification of cells with polar chromosomes in the rescue experiment described in F. n = 2, ≥100 poles, 50 cells. Scale bars: 3 µm (B,C,F); 10 µm (D).
Fig. 2.
Fig. 2.
CENP-Q is required to load CENP-E to kinetochores. (A) Immunofluorescence microscopy images of a metaphase HeLa E1 cells treated with control siRNA, or siRNA against CENP-E (CENP-E siRNA) or CENP-Q for 48 h and then stained with CREST antisera (red) and antibodies against CENP-E (green) and α-tubulin (blue). The image is a z-projection (10 focal planes at 0.2 µm spacing). Yellow arrows point to unaligned kinetochores. Insets show single kinetochore pairs. (B) Immunofluorescence microscopy images of metaphase HeLa E1 cells treated with control, CENP-E or CENP-Q siRNA for 48 h and stained with CREST antisera (red) and antibodies against CENP-Q (green) and α-tubulin (blue). The image is a z-projection (10 focal planes at 0.2 µm spacing). Yellow arrows point to unaligned kinetochores. Insets show single kinetochore pairs. (C) Left panel, quantification of CENP-E immunofluorescence levels in HeLa E1 cells treated with control siRNA, CENP-E siRNA or CENP-Q siRNA for 48 h. The intensities are determined at each kinetochore relative to that of CREST after background subtraction, n≥150 kinetochores per condition from three independent experiments. Dashed line indicates CENP-E levels in control siRNA cells. Error bars indicate ±s.d. Right panel, quantification of CENP-Q immunofluorescence levels in HeLa E1 cells treated with control siRNA, CENP-E siRNA or CENP-Q siRNA for 48 h. Intensities are determined at each kinetochore relative to that of CREST after background subtraction, n≥100 kinetochores per condition from two independent experiments. Dashed line indicates CENP-Q levels in control cells. Error bars indicate ±s.d. (D) Immunofluorescence microscopy images (z-projections, 10 focal planes at 0.2 µm spacing) of a CENP-Q siRNA rescue experiment in HeLa E1 cells. Cells were treated with CENP-Q siRNA or control siRNA for 12 h and then transfected with an siRNA-resistant plasmid expressing CENP-Q–eGFP or a control eGFP expression plasmid for a further 48 h. To reduce the effect of the mitotic stage on alignment, cells were arrested in metaphase with MG132 at a 1 µM final concentration for 90 min, followed by fixation. Cells were stained with antibodies against CENP-A (blue) and CENP-E (red). (E) Quantification of CENP-E immunofluorescence levels in the CENP-Q siRNA rescue experiment detailed in D. Intensities were determined at each kinetochore relative to that of CENP-A after background subtraction, n≥150 kinetochores per condition from three independent experiments. Dashed line indicates CENP-Q levels in cells treated with the control siRNA. Error bars indicate ±s.d. Scale bars: 3 µm (A,B,D).
Fig. 3.
Fig. 3.
Fates of unaligned kinetochore pairs. (A) Schematic representing the orientation of unaligned kinetochore pairs within the mitotic spindle. The black dotted line represents the pole-to-pole axis, dotted green lines on chromosomes 4 and 5 represent the kinetochore sister–sister axis, the ∼90° angle between the sister–sister axis of chromosome 4 and the spindle pole-to-pole axis indicates non-biorientation. The reduced angle (≤45°) of the sister–sister axis relative to spindle axis of chromosome 5 indicates biorientation. Chromosomes 1, 2 and 3 are behind the pole and are therefore non-biorientated. Chromosome 6 is mono-orientated by the pole proximal kinetochore and laterally attached to an adjacent K-fibre by the pole distal kinetochore. Discriminating this chromosome from biorientated chromosomes (e.g. number 5) was not possible in our assay. (B) The orientation state of unaligned kinetochore pairs in CENP-Q- (n = 217 kinetochores) and CENP-E-siRNA- (n = 211 kinetochores) treated HeLa K cells stably expressing eGFP–CENP-A and eGFP–centrin1. Pink represents non-biorientated kinetochores (classes 1, 2, 3 and 4), and orange orientated kinetochores (classes 5 and 6). n≥3 independent experiments. (C) The fates of non-biorientated kinetochore pairs over 5 min in live HeLa K cells (stably expressing eGFP–CENP-A and eGFP–centrin1) after 48 h of treatment with CENP-Q or CENP-E siRNA. (D) The fates of orientated kinetochore pairs over 5 min in live HeLa K cells (stably expressing eGFP–CENP-A and eGFP–centrin1) after 48 h of treatment with CENP-Q or CENP-E siRNA. (E) Example frames from movies of kinetochore fates in HeLa K cells (stably expressing eGFP–CENP-A and eGFP–centrin1) after 48 h of treatment with CENP-Q or CENP-E siRNA. Orange chevrons indicate pairs that are orientated with the spindle axis, blue chevrons indicate pairs that are non-biorientated and white chevrons indicate where the designation of state is unclear. Yellow stars indicate the spindle pole when visible. The first column shows an example of a biorientated kinetochore pair in a CENP-Q-depleted cell, the pair does not congress but switches to a non-biorientated state (supplementary material Movie 3). The second column shows an example of an orientated kinetochore pair that fails to congress in CENP-Q-depleted cells (supplementary material Movie 4). In contrast, the third column shows an example of an orientated sister pair in CENP-E-depleted cells that is still able to congress to the metaphase plate (supplementary material Movie 5). The forth column shows an unaligned non-biorientated sister pair that cannot move to the metaphase plate in a CENP-E-depleted cell (supplementary material Movie 6). t = 0, first frame of the movie. The dashed lines indicate the metaphase plate periphery.
Fig. 4.
Fig. 4.
CENP-Q and CENP-E generate counter forces on polar chromosomes. (A) Schematic representing the measurement of the pole-to-kinetochore distances ‘d’ during depletion of CENP-Q and CENP-E. (B) Immunofluorescence microscopy images of HeLa K cells that had been treated for 48 h with CENP-Q or CENP-E siRNA and stained with CREST antisera (green) and antibodies against α-tubulin (blue) and pericentrin (red). The image is a single z-slice. Insets show enlarged images of the boxed areas. Scale bar: 5 µm. (C) Quantification of pole-to-kinetochore distances in CENP-Q-siRNA- (blue n = 2 159 kinetochores) and CENP-E-siRNA-treated (green, n = 2, 107 kinetochores) cells. Error bars represent ±s.d. (D) Immunofluorescence microscopy image of a HeLa E1 cell stained with antibodies against CENP-A (green) and γ-tubulin (red). Cells were treated for 48 h with control, CENP-Q or CENP-E siRNA followed by 90 min of treatment with 1 µM monastrol to induce monopolarity. The image is a z-projection (all focal planes, 15 µm at 0.2 µm spacing). The successive analysis overlays show the automated process of pole identification and kinetochore identification followed by distance measurement from each kinetochore to the pole. (E) Cumulative distribution of kinetochore distances from the monopole centre in cells that had been treated with control siRNA (red lines, n = 5 experiments with ≥8 cells), CENP-E siRNA (red lines, n = 4, with ≥8 cells) and GSK923295 (purple line, n = 1, 10 cells). Shaded areas represent ±s.d. (F) The cumulative distribution of kinetochore distances from the monopole centre in cells that had been treated with control siRNA (green lines, n = 5, with ≥8 cells) and CENP-Q siRNA (red lines, n = 3, with ≥8 cells). Shaded areas represent ±s.d.
Fig. 5.
Fig. 5.
CENP-QS50A–eGFP rescues kinetochore recruitment of Plk1. (A) Immunofluorescence microscopy images (z-slice) of a CENP-QS50A–eGFP siRNA rescue experiment in HeLa K cells. Cells were treated with CENP-Q siRNA or control siRNA for 12 h and then transfected with an siRNA-resistant plasmid expressing CENP-QS50A–eGFP or a control eGFP expression plasmid for a further 48 h. To reduce the effect of the mitotic stage on alignment, cells were arrested in metaphase with 1 µM MG132 for 90 min before fixation. Cells were stained with CREST antisera (blue) and an antibody against Plk1 (red). Scale bar: 5 µm. (B) Quantification of Plk1 levels in the CENP-QS50A–eGFP siRNA rescue experiment. Staining intensities were determined at each kinetochore relative to that of CREST after background subtraction, n = 3, ≥300 kinetochores, 30 cells. The dashed line indicates CENP-Q levels in control-siRNA-treated cells. Error bars indicate ±s.d.
Fig. 6.
Fig. 6.
CENP-Q serine 50 is required for CENP-E recruitment and orderly congression. (A) Immunofluorescence microscopy images (z-slice) of CENP-QS50A–eGFP and CENP-QS50D–eGFP siRNA rescue experiments in HeLa K cells. Cells were treated with CENP-Q siRNA or control siRNA for 12 h and then transfected with an siRNA-resistant plasmid expressing CENP-Q–eGFP, CENP-QS50A–eGFP or CENP-QS50D–eGFP or a control eGFP expression plasmid for a further 48 h. To reduce the effect of the mitotic stage on alignment, cells were arrested in metaphase with 1 µM MG132 for 90 min before fixation. Cells were stained with antibodies against CENP-A (blue) and CENP-E (red). Scale bar: 5 µm. (B) Left panel, quantification of CENP-E levels in the CENP-QS50A–eGFP and CENP-QS50D–eGFP siRNA rescue experiments. Intensities were determined at each kinetochore relative to that of CENP-A after background subtraction, n = 3, ≥300 kinetochores, ≥30 cells. The dashed line indicates CENP-E levels in control-siRNA-treated cells. Error bars indicate ±s.d. Right panel, quantification of the average number of kinetochore pairs per pole in cells expressing CENP-QS50A–eGFP and CENP-QS50D–eGFP from three independent rescue experiments (120 poles per condition, 60 cells). (C) Box plot showing quantification of kinetochore transgene levels for each CENP-Q variant, n = 3, ≥150 kinetochores. The line represents the median, the box represents the interquartile range, whiskers represent the maximum values excluding outliers, dots represent outliers. (D) Analysis of cells with transgene-positive kinetochores. Box plots showing quantification of the average number of kinetochore pairs per pole, n = 3, ≥60 poles (left panel) and quantification of kinetochore CENP-E levels, n = 3, ≥150 (right panel). Dotted lines indicate the levels in control cells (taken from Fig. 6B). The line represents the median, the box represents the interquartile range, whiskers represent the maximum values excluding outliers, dots represent outliers. (E) A plot demonstrating the relationship between the kinetochore eGFP signal in cells rescued with CENP-Q–eGFP, CENP-Q–eGFPS50A or CENP-Q–eGFPS50D and the kinetochore CENP-E signal, n = 3, ≥150 kinetochores.
Fig. 7.
Fig. 7.
A model for chromosome congression through the combined action of CENP-Q and CENP-E. (A) Schematic showing a proposed model of chromosome congression for unaligned chromosomes positioned between the plate and the pole through the combined action of CENP-Q- and CENP-E-dependent mechanisms. Chromosome 1 is mono-orientated and laterally attached ‘L’ at the black sister kinetochore through CENP-E, this chromosome is able to congress to the plate through lateral sliding, driven by CENP-E, where it is then able to biorientate (as reported in Kapoor et al., 2006). Chromosome 2 is biorientated and able to congress to the metaphase plate by making persistent plateward movements that are driven by CENP-Q-dependent microtubule depolymerisation-coupled pulling at the poleward (P) kinetochore. Chromosome 3 is mono-orientated and will engage its free kinetochore with either the microtubule lattice or the plus-end of microtubules emanating from the opposite pole in order to congress through CENP-E- and/or CENP-Q-dependent pathways. Chromosome 4 is biorientated and aligned at the metaphase plate. AP, away from pole movement. (B) Schematic showing the mechanisms acting on chromosomes positioned behind the spindle poles. Arrows indicate the direction of the generated forces. CENP-E lateral sliding and polar ejection forces (PEFs) move chromosomes anti-poleward, whereas CENP-Q-dependent depolymerisation-coupled pulling and dynein-driven lateral sliding move chromosomes poleward. Force balance amongst these mechanisms dictates the distance of a chromosome from the spindle pole, and kinetochores are probably able to cycle between these attachment states (grey arrow). (C) Schematic showing kinetochore loading and phosphorylation dependencies. Solid black lines represent direct loading dependencies (percentage values indicate the level of dependency). Black dashed lines represent loading dependencies, which are indirect (or have not been shown to be direct). Blue lines represent phosphorylation events, and red arrows represent proteins that have been shown to make direct contact with the microtubule. Percentage dependencies were obtained from the following references: [1] (Maia et al., 2012), [2], (Maffini et al., 2009), [3] (Kang et al., 2006), [4] this study and [5] (Kang et al., 2011). Dependencies within CCAN were obtained from several references (Foltz et al., 2006; McClelland et al., 2007; Okada et al., 2006). The separation of the CCAN into core and extended components is taken from Westhorpe and Straight (Westhorpe and Straight, 2013).

References

    1. Ahonen L. J., Kallio M. J., Daum J. R., Bolton M., Manke I. A., Yaffe M. B., Stukenberg P. T., Gorbsky G. J. (2005). Polo-like kinase 1 creates the tension-sensing 3F3/2 phosphoepitope and modulates the association of spindle-checkpoint proteins at kinetochores. Curr. Biol. 15, 1078–1089 10.1016/j.cub.2005.05.026 - DOI - PubMed
    1. Amaro A. C., Samora C. P., Holtackers R., Wang E., Kingston I. J., Alonso M., Lampson M., McAinsh A. D., Meraldi P. (2010). Molecular control of kinetochore-microtubule dynamics and chromosome oscillations. Nat. Cell Biol. 12, 319–329 10.1038/ncb2033 - DOI - PMC - PubMed
    1. Basilico F., Maffini S., Weir J. R., Prumbaum D., Rojas A. M., Zimniak T., De Antoni A., Jeganathan S., Voss B., van Gerwen S. et al. (2014). The pseudo GTPase CENP-M drives human kinetochore assembly. eLife 3, e02978 10.7554/eLife.02978 - DOI - PMC - PubMed
    1. Cai S., O’Connell C. B., Khodjakov A., Walczak C. E. (2009). Chromosome congression in the absence of kinetochore fibres. Nature Cell Biology 11 (7), 832–8. - PMC - PubMed
    1. Coue M., Lombillo V. A., McIntosh J. R. (1991). Microtubule depolymerization promotes particle and chromosome movement in vitro. J. Cell Biol. 112, 1165–1175 10.1083/jcb.112.6.1165 - DOI - PMC - PubMed

Publication types

MeSH terms