. 2014 Dec 1;28(23):2597-612.
doi: 10.1101/gad.253302.114. Epub 2014 Nov 13.

Inflammatory signaling regulates embryonic hematopoietic stem and progenitor cell production

Affiliations

Inflammatory signaling regulates embryonic hematopoietic stem and progenitor cell production

Yan Li et al. Genes Dev. .

Abstract

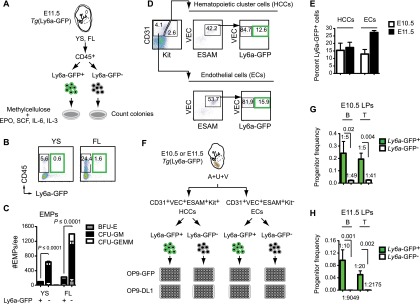
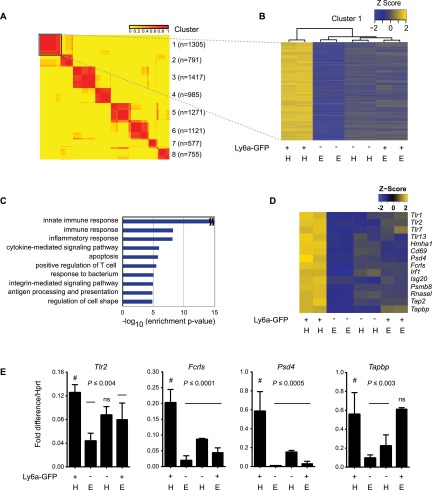
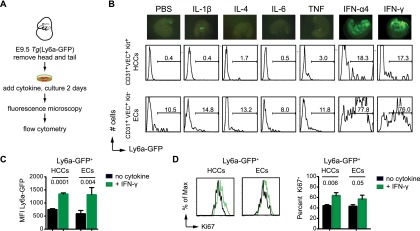
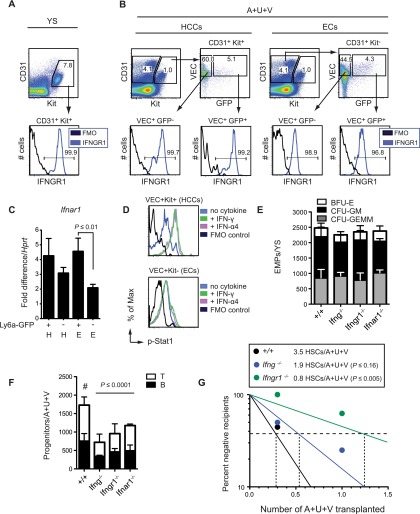
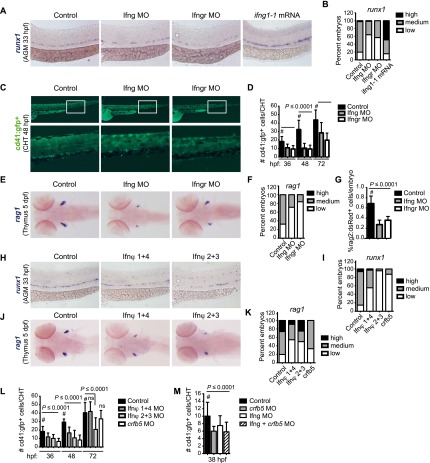
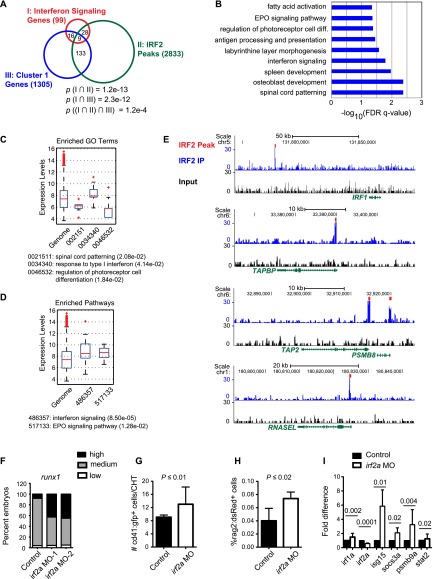
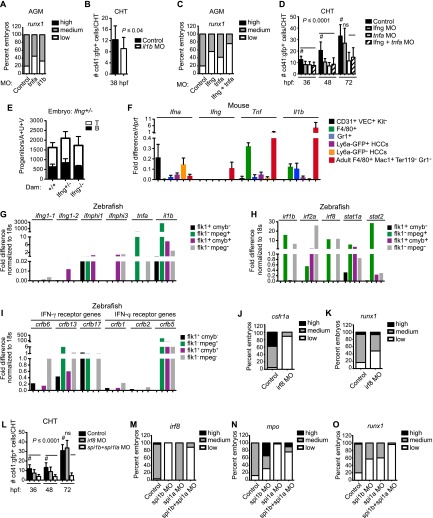
Identifying signaling pathways that regulate hematopoietic stem and progenitor cell (HSPC) formation in the embryo will guide efforts to produce and expand HSPCs ex vivo. Here we show that sterile tonic inflammatory signaling regulates embryonic HSPC formation. Expression profiling of progenitors with lymphoid potential and hematopoietic stem cells (HSCs) from aorta/gonad/mesonephros (AGM) regions of midgestation mouse embryos revealed a robust innate immune/inflammatory signature. Mouse embryos lacking interferon γ (IFN-γ) or IFN-α signaling and zebrafish morphants lacking IFN-γ and IFN-ϕ activity had significantly fewer AGM HSPCs. Conversely, knockdown of IFN regulatory factor 2 (IRF2), a negative regulator of IFN signaling, increased expression of IFN target genes and HSPC production in zebrafish. Chromatin immunoprecipitation (ChIP) combined with sequencing (ChIP-seq) and expression analyses demonstrated that IRF2-occupied genes identified in human fetal liver CD34(+) HSPCs are actively transcribed in human and mouse HSPCs. Furthermore, we demonstrate that the primitive myeloid population contributes to the local inflammatory response to impact the scale of HSPC production in the AGM region. Thus, sterile inflammatory signaling is an evolutionarily conserved pathway regulating the production of HSPCs during embryonic development.

Keywords: hematopoiesis; hematopoietic stem cell; interferon; lymphoid progenitor; mouse; zebrafish.


Figures

Figure 1.
Figure 1.
Ly6a-GFP expression marks LPs but not EMPs. (A) Scheme for isolating Ly6a-GFP+/− CD45+ cells from E11.5 embryos and methylcellulose colony-forming assays to quantify EMPs. (B) Scatter plots of representative sort samples for colony assays. (C) Number of EMPs per embryo equivalent (ee) of the indicated tissue. (BFU-E) Burst-forming units erythroid; (CFU-GM) colony-forming units granulocyte/monocyte; (CFU-GEMM) CFUs granulocyte/erythrocyte/monocyte/megakaryocyte. Error bars represent mean ± 95% CI. Data are from three replicates, using pooled embryos. P-values were calculated by t-test as described in the Materials and Methods. (D) Representative scatter plots of cell isolation for lymphoid progenitor assays. (E) Percentage of Ly6a-GFP+ cells in the hematopoietic cluster (HCC: CD31+VEC+ESAM+Kit+) and endothelial (EC: CD31+VEC+ESAM+Kit) populations. Data are averaged from five to six litters of pooled embryos (mean ± SD). (F) Scheme for limiting dilution assay to enumerate progenitors with B and T potential (LPs) on OP9-GFP and OP9-DL1 stromal cells, respectively. B cells were identified as CD19+ B220+, and T cells were identified as CD25+ Thy1.1+. (G) Frequency of LPs in the Ly6a-GFP+ and Ly6a-GFP fractions of HCCs from E10.5 embryos (mean ± SD). Progenitor frequency is indicated above columns. Data are from three experiments using pooled cells from Tg(Ly6a-GFP) embryos. Additional data, including cell numbers, are summarized in Supplemental Table S1. (H) Frequency of LPs at E11.5, as in G (n = 4 experiments) (see also Supplemental Table S1).
Figure 2.
Figure 2.
Ly6a-GFP+ HCCs have an innate immune/inflammatory signature. (A) Consensus clustering of microarray data from Ly6a-GFP+ and Ly6a-GFP HCCs and ECs. Sorts were performed as in Figure 1D. Duplicate RNA samples from each population (four total; ∼15,000 cells per sample) were analyzed by microarray. Each row represents one gene. Values in the key represent the frequency at which two genes were observed to cluster together. Cluster numbers, including gene number (n) within each set, are indicated at the right. C1 (boxed) is expanded in B. (B) Dendrogram of C1. Gene expression levels are normalized by Z-score transformation across microarray experiments. (H) HCCs; (E) ECs. (C) Top 10 enriched GO biological process terms among C1 genes. (D) Examples of innate immune/inflammatory genes with up-regulated expression in Ly6a-GFP+ HCCs. (E) qPCR analysis of several genes in D represented as fold difference relative to Hprt (n = 3, mean ± SD). Significance is by one-way ANOVA and Dunnett’s multiple comparison test with Ly6a-GFP+ HCCs as a comparator (#). (ns) Not significant.
Figure 3.
Figure 3.
Type I and II IFNs induce Ly6a-GFP expression in embryo explants. (A) Experimental scheme to identify inflammatory cytokines capable of inducing Ly6a-GFP expression in 2-d embryo explant cultures. (B, top) Fluorescent images of embryo explants after 2 d of culture with the indicated cytokines (20 ng/mL). Representative histograms of GFP levels in HCCs (middle) and ECs (bottom). Data are representative of three experiments. (C) Increase in Ly6a-GFP MFI in HCCs and ECs following 2 d of explant culture. (n = 4; mean ± SD; t-test). (D) Increase in the percentage of Ki67+ cells in the Ly6a-GFP+ HCC and EC populations after 2 d of explant culture (n = 3; mean ± SD; t-test; representative histograms are at the left).
Figure 4.
Figure 4.
IFNγ signaling regulates embryonic hematopoiesis. (A) Flow cytometry for IFNGR1 on CD31+Kit+ YS EMPs (E11.5). (FMO) Fluorescence minus one control. (B) Flow cytometry for IFNGR1 on Ly6a-GFP+/− HCCs and ECs from the A+U+V (E11.5). (C) qPCR for Ifnar1 mRNA in Ly6a-GFP+/− HCCs (H) and ECs (E) (E10.5) shown as fold difference/Hprt. (D) Increase in p-Stat1 in HCCs (VEC+Kit+) but not ECs (VEC+Kit) 15 min after addition of 50 ng/mL IFN-γ or IFN-α4 to disaggregated A+U+V cells (E10.5). (E) Number of EMPs per YS in E10.5 wild-type (WT) embryos and those deficient for IFN signaling (n = 7–14 embryos; mean ± SD; one-way ANOVA). (F) Number of LPs per A+U+V in E10.5 wild-type embryos and those deficient in IFN-γ or IFN-α signaling determined by limiting dilution on OP9 and OP9-DL1 stromal cells. P-values for total number of LPs (B+T) calculated by one-way ANOVA and Dunnett’s multiple comparison tests (n = 3–9 from two experiments; mean ± SD). (G) Determination of HSC numbers by limited dilution transplantation. Irradiated adult recipients (Ly5.1) were transplanted with the indicated fractions (1.0 or 0.3 embryo equivalents) of A+U+V cells (Ly5.2). The contribution of donor cells (positive engraftment scored as >1%) to CD34Flt3LSK BM was analyzed at 16 wk (n = 7–10 from eight experiments). Number of LT-HSCs per A+U+V and significance from wild type were determined by extreme limiting dilution analysis (Hu and Smyth 2009).
Figure 5.
Figure 5.
IFN signaling regulates hematopoiesis in zebrafish embryos. (A) Whole-mount in situ hybridization (WISH) for runx1 in the AGM region of representative embryos injected with MOs targeting Ifng (ifng1.1 plus ifng1.2) or the IFN-γ receptors (crfb6, crfb13, and crfb17) (Ifngr MO) or with mRNA for ifng1-1 compared with sibling controls at 33 hpf (n ≥ 100 embryos per condition, from four experiments). (B) Bar graph showing qualitative phenotypic distribution as percent of embryos from A scored with low, medium, or high runx1 expression in the AGM. (C) Representative effects of Ifng and Ifngr knockdown on cd41:gfp+ HSPCs in the CHT at 48 hpf. Boxed areas in the top panels are magnified in the panels below. (D) Absolute counts of cd41:gfp+ cells in the CHT were determined at fixed time intervals (n ≥ 17 embryos per condition). P-value, determined for each time point relative to control (#), was ≤0.0001 at all time windows. (E) WISH for rag1 expression in the thymi of representative embryos at 5 dpf following Ifng and Ifngr knockdown (n ≥ 7 embryos per condition). (F) Qualitative phenotypic distribution as percentage of embryos scored with low, medium, or high rag1 expression. (G) Percentage of rag2:dsRed+ cells in total 5-dpf fish embryos quantified by flow cytometry (ANOVA, n ≥ 4 replicates of five pooled embryos). (H) WISH for runx1 in the AGM of representative embryos (n ≥ 23 embryos per condition) injected with paired MOs targeting IFN-ϕs. (I) Phenotype distribution of embryos from H, scored as in B. (J) WISH for rag1 in the thymi of representative embryos (n ≥ 23 embryos per condition) injected with paired MOs targeting IFN-ϕs. (K) Phenotype distribution of embryos from J, scored as in F. (L) cd41:gfp+ cells in the CHT following MO knockdown of IFN-ϕs and crfb5 (n ≥ 19 embryos per condition). Error bars indicate SD. (ns) Not significant. (M) cd41:gfp+ cells in the CHT at 38 hpf following MO knockdown of Ifng and crfb5 alone or in combination (n = 8–20 embryos per condition).
Figure 6.
Figure 6.
IRF2 target genes in human CD34+ FL HSPCs overlap with IFN pathway genes and C1 genes. (A) Venn diagram of IFN signaling genes expressed in hCD34+ FL HSPCs, C1 genes (expressed in Ly6a-GFP+ HCCs), and IRF2-bound genes in hCD34+ FL HSPCs. P-values for overlap between all three sets were computed using a hypergeometric test. P-values for overlap of IRF2-bound and expressed genes were computed using GREAT. (B) Enriched GO biological process terms for IRF2-bound genes determined by GREAT. (C) Expression levels of IRF2-bound targets relative to all genes in hCD34+ FL HSPCs enriched for GO terms. P-values (in parentheses) as computed by t-test. Gene expression was analyzed from previously published Affymetrix microarray data (Xu et al. 2012). Only genes annotated with GO terms that had significantly different expression compared with the genome background are shown. (D) Expression levels of all genes and IRF2-bound genes in hCD34+ FL HSPCs enriched for representative pathway terms, as in C. (E) ChIP-seq signals for representative IFN pathway genes bound by IRF2. (F) Phenotype distribution of runx1 expression by WISH (AGM region) for irf2a morphants generated with two independent MOs compared with sibling controls (n ≥ 40 embryos per condition). (G) Absolute number of cd41:gfp+ HSPCs in the CHT of irf2a morphants at 38 hpf (n = 17; mean ± SD; t-test). (H) Percent of rag2:dsRed+ cells in whole embryos at 5 dpf by flow cytometry in irf2a morphants (n = 7; mean ± SD; t-test). (I) qPCR for IRF2 target genes in irf2a morphants (n = 2, from four replicates; mean ± SD; t-test).
Figure 7.
Figure 7.
Multiple inflammatory cytokines and primitive myeloid cells promote HSPC formation. (A) Phenotype distribution of runx1 expression by WISH (AGM region) for tnfa or il1b morphants compared with sibling controls (n ≥ 77 embryos per condition). (B) Absolute number of cd41:gfp+ HSPCs in the CHT of il1b morphants (n ≥ 17; mean ± SD; t-test). (C) Phenotype distribution of runx1 expression by WISH (AGM) for lnfg knockdown alone and in combination with tnfa MOs (n ≥ 54 embryos per condition). (D) Absolute counts of cd41:gfp+ cells in the CHT determined at fixed times intervals in embryos (n ≥ 18 embryos per condition) with lnfg MO ± tnfa MO. P-value, as in Figure 5D, was ≤0.0001 at each time point (one-way ANOVA; [ns] not significant). (E) Number of LPs per A+U+V in E10.5 Ifng+/− mouse embryos from wild-type (+/+), Ifng+/−, and Ifng−/− dams (n = 3; mean ± SD; t-test). (F) qPCR for proinflammatory cytokine mRNAs in E10.5 mouse ECs (CD31+VEC+Kit), macrophages (F4/80+), granulocytes (Gr1+), and Ly6a-GFP+/− HCCs, normalized to Hprt (n = 3; mean ± SD). mRNA levels in professional inflammatory cells (F4/80+ Mac1+ Ter119 Gr1 macrophages) are shown for comparison. (G) qPCR for proinflammatory cytokine mRNAs from sorted zebrafish embryo fractions: EC (flk1+cmyb), macrophage (flk1mpeg+), HCC (flk1+cmyb+), and nonhematovascular (flk1mpeg) (normalized to 18S; n = 2 replicates in two experiments; mean ± SD; t-test). (H) qPCR for IFN pathway regulatory targets and transcription factors from sorted zebrafish embryo fractions, as in G. (I) qPCR for IFN-γ and IFN-ϕ receptor mRNAs from sorted zebrafish embryo fractions, as above. (J) Phenotype distribution of csf1ra expression by WISH in irf8 morphants (n ≥ 31 embryos per condition). (K) Phenotype distribution of runx1 expression by WISH (AGM) in irf8 morphants (n ≥ 28 embryos per condition). (L) Absolute counts of cd41:gfp+ cells in the CHT, as in D, following irf8 knockdown or combinatorial reductions of spi1a and spi1b (n ≥ 29 embryos per condition; one-way ANOVA). (M) Phenotype distribution of irf8 expression by WISH following MO knockdown of spi1a and spi1b alone and in combination (n ≥ 28 embryos per condition). (N) Phenotype distribution of mpo expression by WISH following MO knockdown, as in M (n ≥ 29 embryos per condition). (O) Phenotype distribution of runx1 expression by WISH (AGM) following MO knockdown (n ≥ 40 embryos per condition).

References

    1. Abrahams VM. 2008. Pattern recognition at the maternal-fetal interface. Immunol Invest 37: 427–447. - PubMed
    1. Adamo L, Naveiras O, Wenzel PL, McKinney-Freeman S, Mack PJ, Gracia-Sancho J, Suchy-Dicey A, Yoshimoto M, Lensch MW, Yoder MC, et al. . 2009. Biomechanical forces promote embryonic haematopoiesis. Nature 459: 1131–1135. - PMC - PubMed
    1. Anderson KV, Bokla L, Nusslein-Volhard C. 1985. Establishment of dorsal-ventral polarity in the Drosophila embryo: the induction of polarity by the Toll gene product. Cell 42: 791–798. - PubMed
    1. Baldridge MT, King KY, Boles NC, Weksberg DC, Goodell MA. 2010. Quiescent haematopoietic stem cells are activated by IFN-γ in response to chronic infection. Nature 465: 793–797. - PMC - PubMed
    1. Balounova J, Vavrochova T, Benesova M, Ballek O, Kolar M, Filipp D. 2014. Toll-like receptors expressed on embryonic macrophages couple inflammatory signals to iron metabolism during early ontogenesis. Eur J Immunol 44: 1491–1502. - PubMed

Publication types

MeSH terms