

A determination and comparison of urease activity in feces and fresh manure from pig and cattle in relation to ammonia production and pH changes
- PMID: 25397404
- PMCID: PMC4232307
- DOI: 10.1371/journal.pone.0110402
A determination and comparison of urease activity in feces and fresh manure from pig and cattle in relation to ammonia production and pH changes
Abstract
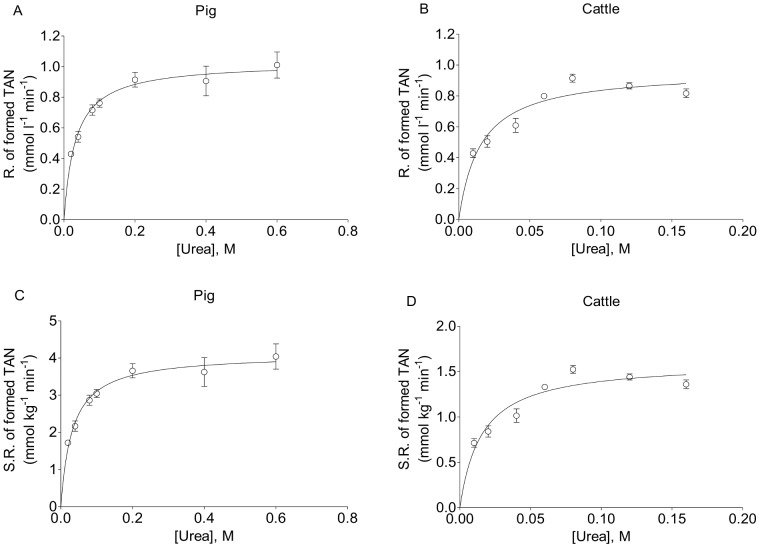
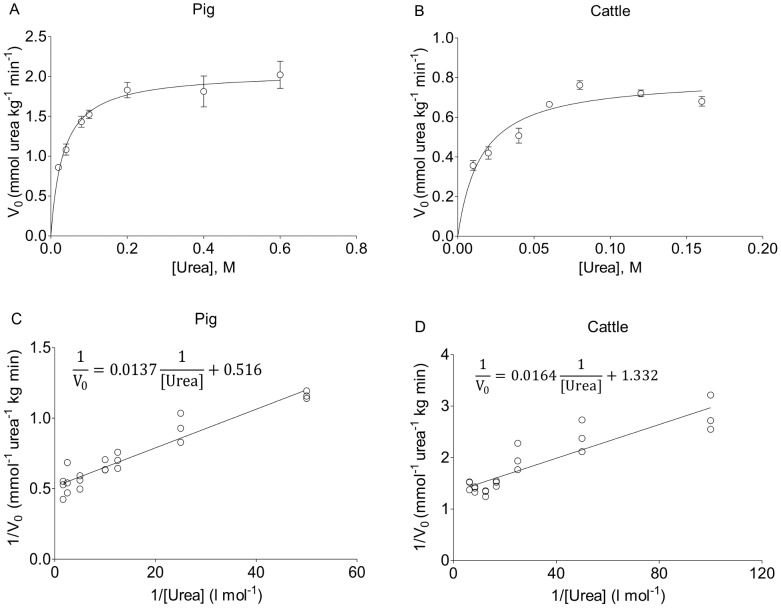
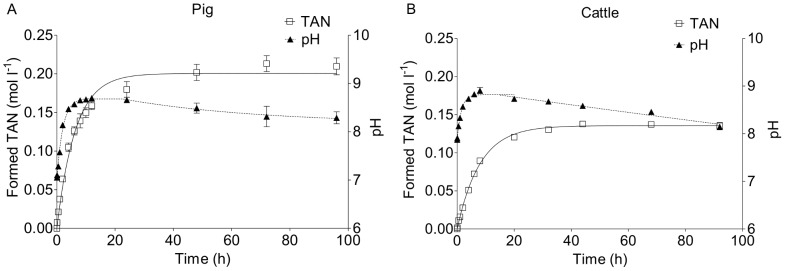
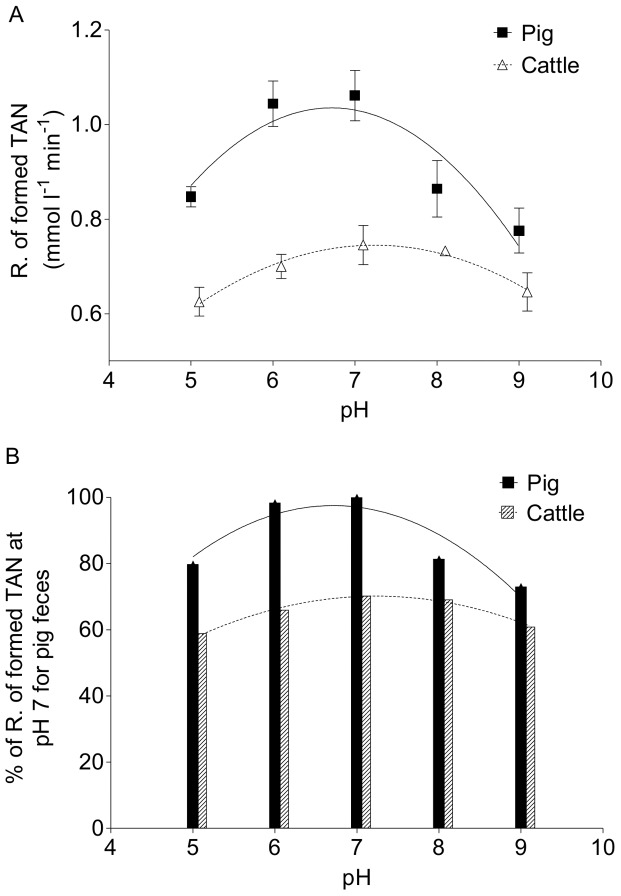
Ammonia emission from animal production is a major environmental problem and has impacts on the animal health and working environment inside production houses. Ammonia is formed in manure by the enzymatic degradation of urinary urea and catalyzed by urease that is present in feces. We have determined and compared the urease activity in feces and manure (a urine and feces mixture) from pigs and cattle at 25°C by using Michaelis-Menten kinetics. To obtain accurate estimates of kinetic parameters Vmax and K'm, we used a 5 min reaction time to determine the initial reaction velocities based on total ammoniacal nitrogen (TAN) concentrations. The resulting Vmax value (mmol urea hydrolyzed per kg wet feces per min) was 2.06±0.08 mmol urea/kg/min and 0.80±0.04 mmol urea/kg/min for pig feces and cattle feces, respectively. The K'm values were 32.59±5.65 mmol urea/l and 15.43±2.94 mmol urea/l for pig feces and cattle feces, respectively. Thus, our results reveal that both the Vmax and K'm values of the urease activity for pig feces are more than 2-fold higher than those for cattle feces. The difference in urea hydrolysis rates between animal species is even more significant in fresh manure. The initial velocities of TAN formation are 1.53 mM/min and 0.33 mM/min for pig and cattle manure, respectively. Furthermore, our investigation shows that the maximum urease activity for pig feces occurs at approximately pH 7, and in cattle feces it is closer to pH 8, indicating that the predominant fecal ureolytic bacteria species differ between animal species. We believe that our study contributes to a better understanding of the urea hydrolysis process in manure and provides a basis for more accurate and animal-specific prediction models for urea hydrolysis rates and ammonia concentration in manures and thus can be used to predict ammonia volatilization rates from animal production.
Conflict of interest statement
Figures
Similar articles
-
Short communication: Urea hydrolysis in dairy cattle manure under different temperature, urea, and pH conditions.J Dairy Sci. 2017 Mar;100(3):2388-2394. doi: 10.3168/jds.2016-11927. Epub 2017 Jan 11. J Dairy Sci. 2017. PMID: 28088412
-
Prediction of ammonia emission from dairy cattle manure based on milk urea nitrogen: relation of milk urea nitrogen to ammonia emissions.J Dairy Sci. 2010 Jun;93(6):2377-86. doi: 10.3168/jds.2009-2415. J Dairy Sci. 2010. PMID: 20494146
-
Conservation of nitrogen in cattle feedlot waste with urease inhibitors.J Anim Sci. 1999 May;77(5):1162-8. doi: 10.2527/1999.7751162x. J Anim Sci. 1999. PMID: 10340583
-
Diet effects on urine composition of cattle and N2O emissions.Animal. 2013 Jun;7 Suppl 2:292-302. doi: 10.1017/S1751731113000578. Animal. 2013. PMID: 23739471 Review.
-
Urea-Urease Reaction in Controlling Properties of Supramolecular Hydrogels: Pros and Cons.Chemistry. 2021 Jun 21;27(35):8928-8939. doi: 10.1002/chem.202100490. Epub 2021 May 13. Chemistry. 2021. PMID: 33861488 Free PMC article. Review.
Cited by
-
Dynamics of Different Buffer Systems in Slurries Based on Time and Temperature of Storage and Their Visualization by a New Mathematical Tool.Animals (Basel). 2020 Apr 21;10(4):724. doi: 10.3390/ani10040724. Animals (Basel). 2020. PMID: 32326372 Free PMC article.
-
Three-step in vitro digestion model for evaluating and predicting fecal odor emission from growing pigs with different dietary protein intakes.Anim Biosci. 2022 Oct;35(10):1592-1605. doi: 10.5713/ab.21.0498. Epub 2022 Apr 22. Anim Biosci. 2022. PMID: 35468273 Free PMC article.
-
Acidification of pig slurry effects on ammonia and nitrous oxide emissions, nitrate leaching, and perennial ryegrass regrowth as estimated by 15N-urea flux.Asian-Australas J Anim Sci. 2018 Mar;31(3):457-466. doi: 10.5713/ajas.17.0556. Epub 2017 Dec 19. Asian-Australas J Anim Sci. 2018. PMID: 29268577 Free PMC article.
-
Chemosensory detection of aversive concentrations of ammonia and basic volatile amines in insects.iScience. 2022 Dec 8;26(1):105777. doi: 10.1016/j.isci.2022.105777. eCollection 2023 Jan 20. iScience. 2022. PMID: 36594011 Free PMC article.
-
A Narrative Review of Gut-Muscle Axis and Sarcopenia: The Potential Role of Gut Microbiota.Int J Gen Med. 2021 Apr 13;14:1263-1273. doi: 10.2147/IJGM.S301141. eCollection 2021. Int J Gen Med. 2021. PMID: 33880058 Free PMC article. Review.
References
-
- Aneja VP, Schlesinger WH, Erisman JW (2009) Effects of agriculture upon the air quality and climate: research, policy, and regulations. Environ Sci Technol 43: 4234–4240. - PubMed
-
- Bouwman AF, VanderHoek KW (1997) Scenarios of animal waste production and fertilizer use and associated ammonia emission for the developing countries. Atmospheric Environment 31: 4095–4102.
-
- Eghball B, Power JF (1994) Beef-Cattle Feedlot Manure Management. Journal of Soil and Water Conservation 49: 113–122.
-
- Krajewska B (2009) Ureases I. Functional, catalytic and kinetic properties: A review. Journal of Molecular Catalysis B: Enzymatic 59: 9–21.
Publication types
MeSH terms
Substances
LinkOut - more resources
Full Text Sources
Other Literature Sources
Medical
