

Prediction of metabolic flux distribution from gene expression data based on the flux minimization principle
- PMID: 25397773
- PMCID: PMC4232356
- DOI: 10.1371/journal.pone.0112524
Prediction of metabolic flux distribution from gene expression data based on the flux minimization principle
Abstract
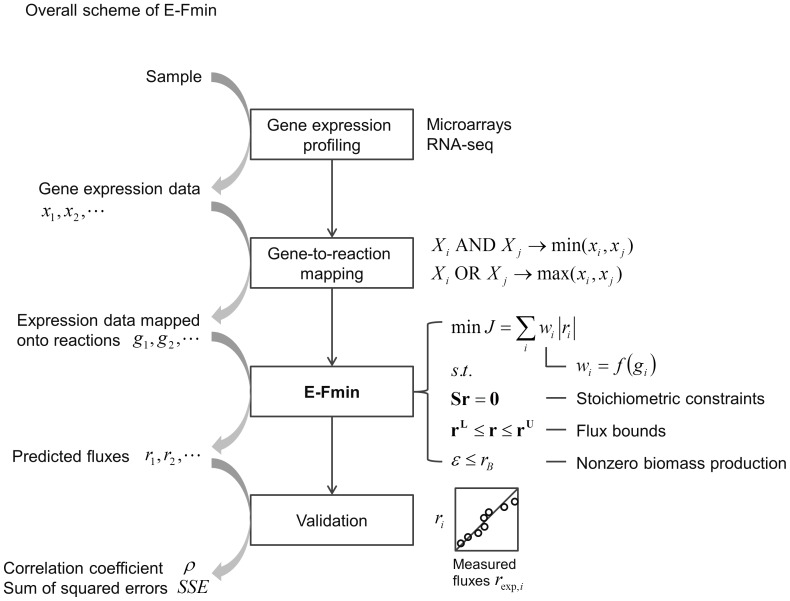
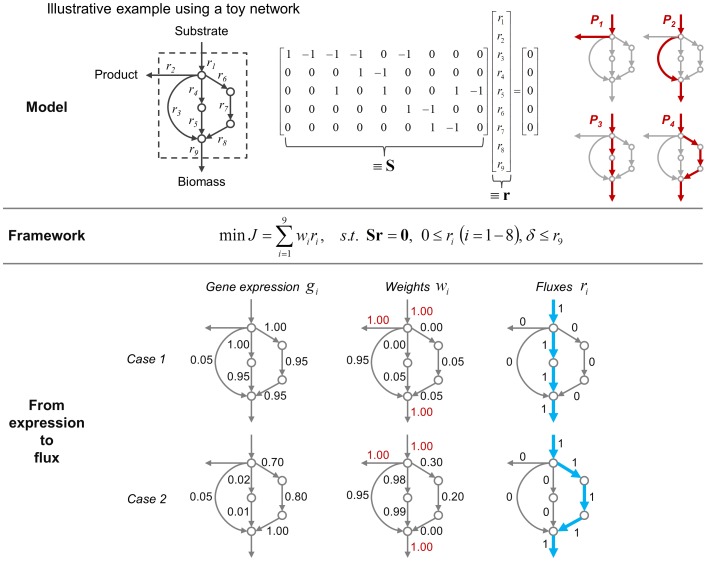
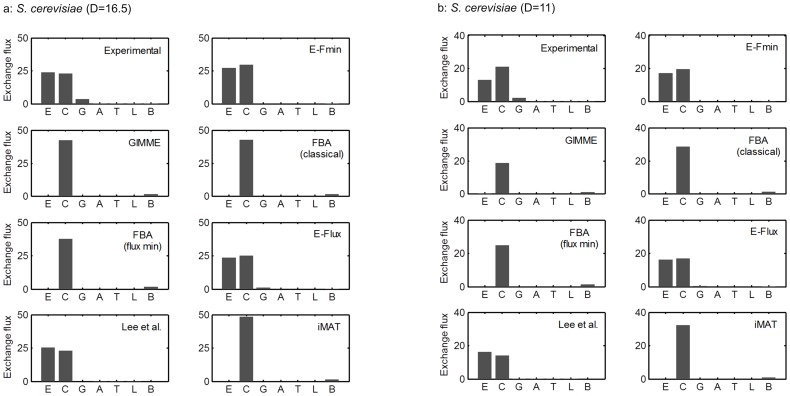
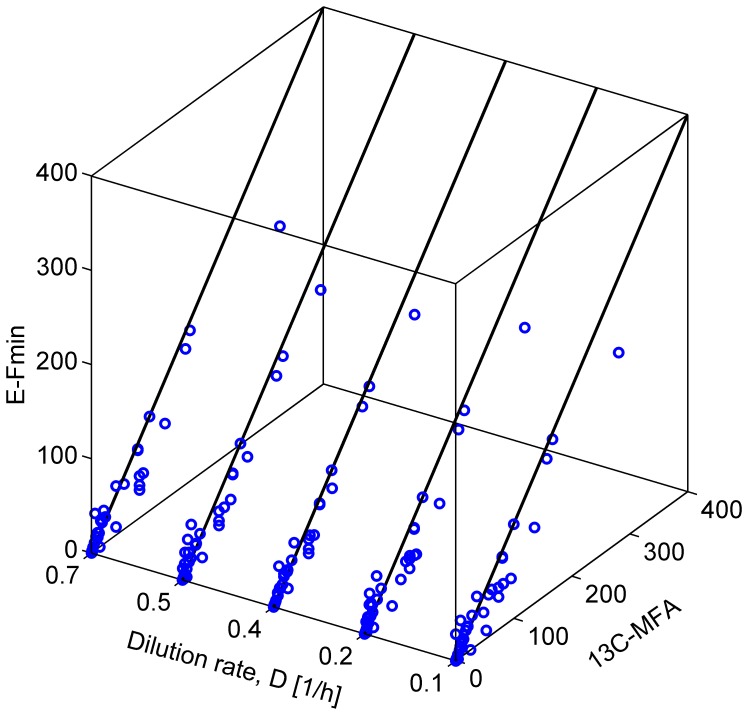
Prediction of possible flux distributions in a metabolic network provides detailed phenotypic information that links metabolism to cellular physiology. To estimate metabolic steady-state fluxes, the most common approach is to solve a set of macroscopic mass balance equations subjected to stoichiometric constraints while attempting to optimize an assumed optimal objective function. This assumption is justifiable in specific cases but may be invalid when tested across different conditions, cell populations, or other organisms. With an aim to providing a more consistent and reliable prediction of flux distributions over a wide range of conditions, in this article we propose a framework that uses the flux minimization principle to predict active metabolic pathways from mRNA expression data. The proposed algorithm minimizes a weighted sum of flux magnitudes, while biomass production can be bounded to fit an ample range from very low to very high values according to the analyzed context. We have formulated the flux weights as a function of the corresponding enzyme reaction's gene expression value, enabling the creation of context-specific fluxes based on a generic metabolic network. In case studies of wild-type Saccharomyces cerevisiae, and wild-type and mutant Escherichia coli strains, our method achieved high prediction accuracy, as gauged by correlation coefficients and sums of squared error, with respect to the experimentally measured values. In contrast to other approaches, our method was able to provide quantitative predictions for both model organisms under a variety of conditions. Our approach requires no prior knowledge or assumption of a context-specific metabolic functionality and does not require trial-and-error parameter adjustments. Thus, our framework is of general applicability for modeling the transcription-dependent metabolism of bacteria and yeasts.
Conflict of interest statement
Figures
Similar articles
-
Prediction of metabolic fluxes from gene expression data with Huber penalty convex optimization function.Mol Biosyst. 2017 May 2;13(5):901-909. doi: 10.1039/c6mb00811a. Mol Biosyst. 2017. PMID: 28338129
-
Genome-Scale 13C Fluxomics Modeling for Metabolic Engineering of Saccharomyces cerevisiae.Methods Mol Biol. 2019;1859:317-345. doi: 10.1007/978-1-4939-8757-3_19. Methods Mol Biol. 2019. PMID: 30421239
-
A hybrid model of anaerobic E. coli GJT001: combination of elementary flux modes and cybernetic variables.Biotechnol Prog. 2008 Sep-Oct;24(5):993-1006. doi: 10.1002/btpr.73. Biotechnol Prog. 2008. PMID: 19194908
-
Metabolic flux prediction in cancer cells with altered substrate uptake.Biochem Soc Trans. 2015 Dec;43(6):1177-81. doi: 10.1042/BST20150149. Biochem Soc Trans. 2015. PMID: 26614657 Review.
-
Dynamic metabolic flux analysis--tools for probing transient states of metabolic networks.Curr Opin Biotechnol. 2013 Dec;24(6):973-8. doi: 10.1016/j.copbio.2013.03.018. Epub 2013 Apr 20. Curr Opin Biotechnol. 2013. PMID: 23611566 Review.
Cited by
-
Assessment of flux through oleoresin biosynthesis in epithelial cells of loblolly pine resin ducts.J Exp Bot. 2019 Jan 1;70(1):217-230. doi: 10.1093/jxb/ery338. J Exp Bot. 2019. PMID: 30312429 Free PMC article.
-
A Hybrid Flux Balance Analysis and Machine Learning Pipeline Elucidates Metabolic Adaptation in Cyanobacteria.iScience. 2020 Nov 18;23(12):101818. doi: 10.1016/j.isci.2020.101818. eCollection 2020 Dec 18. iScience. 2020. PMID: 33354660 Free PMC article.
-
Short-term metabolic adjustments in Plasmodium falciparum counter hypoxanthine deprivation at the expense of long-term viability.Malar J. 2019 Mar 19;18(1):86. doi: 10.1186/s12936-019-2720-3. Malar J. 2019. PMID: 30890151 Free PMC article.
-
Integrating Ecological and Engineering Concepts of Resilience in Microbial Communities.Front Microbiol. 2015 Dec 1;6:1298. doi: 10.3389/fmicb.2015.01298. eCollection 2015. Front Microbiol. 2015. PMID: 26648912 Free PMC article.
-
A multi-organ maize metabolic model connects temperature stress with energy production and reducing power generation.iScience. 2023 Nov 7;26(12):108400. doi: 10.1016/j.isci.2023.108400. eCollection 2023 Dec 15. iScience. 2023. PMID: 38077131 Free PMC article.
References
-
- Matsushika A, Inoue H, Kodaki T, Sawayama S (2009) Ethanol production from xylose in engineered Saccharomyces cerevisiae strains: current state and perspectives. Appl Microbiol Biotechnol 84: 37–53. - PubMed
-
- Kim HU, Sohn SB, Lee SY (2012) Metabolic network modeling and simulation for drug targeting and discovery. Biotechnol J 7: 330–342. - PubMed
-
- Chiaradonna F, Moresco RM, Airoldi C, Gaglio D, Palorini R, et al. (2012) From cancer metabolism to new biomarkers and drug targets. Biotechnol Adv 30: 30–51. - PubMed
-
- Zamboni N, Fendt SM, Ruhl M, Sauer U (2009) 13C-based metabolic flux analysis. Nat Protoc 4: 878–892. - PubMed
Publication types
MeSH terms
Substances
LinkOut - more resources
Full Text Sources
Other Literature Sources
Molecular Biology Databases
