

SplitMEM: a graphical algorithm for pan-genome analysis with suffix skips
- PMID: 25398610
- PMCID: PMC4253837
- DOI: 10.1093/bioinformatics/btu756
SplitMEM: a graphical algorithm for pan-genome analysis with suffix skips
Abstract
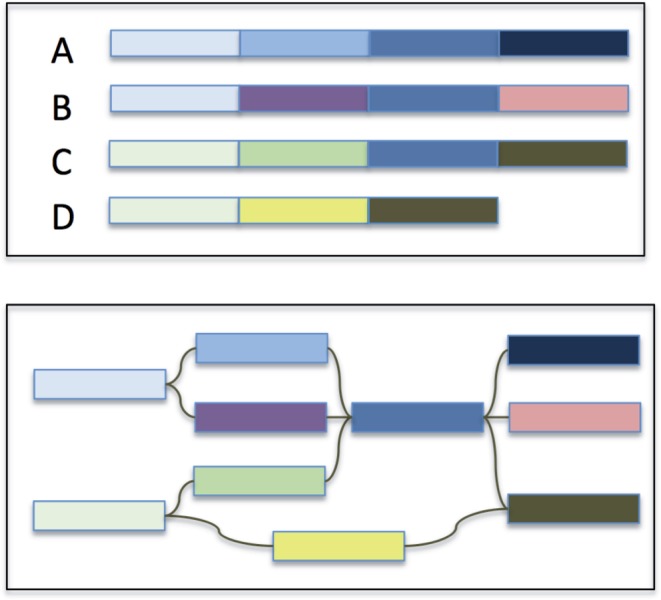
Motivation: Genomics is expanding from a single reference per species paradigm into a more comprehensive pan-genome approach that analyzes multiple individuals together. A compressed de Bruijn graph is a sophisticated data structure for representing the genomes of entire populations. It robustly encodes shared segments, simple single-nucleotide polymorphisms and complex structural variations far beyond what can be represented in a collection of linear sequences alone.
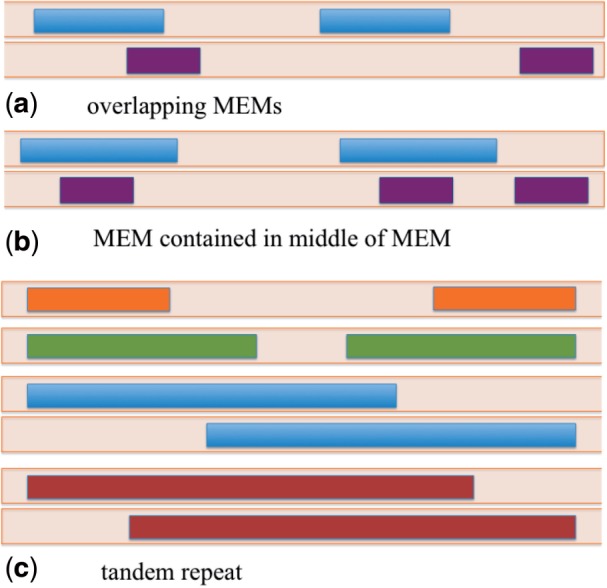
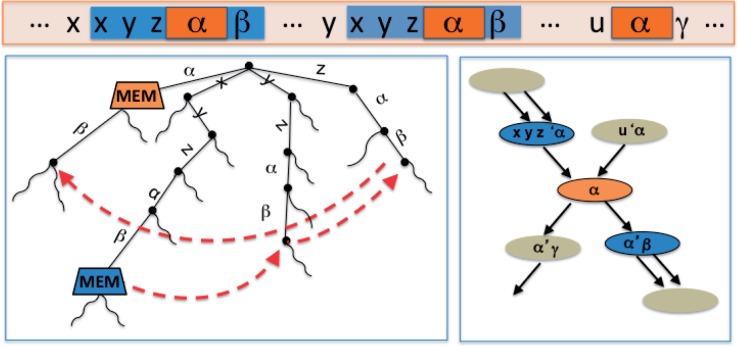
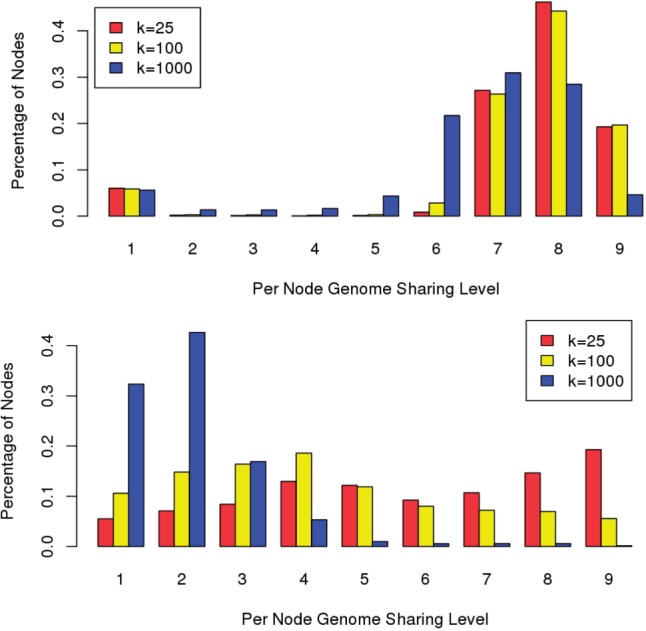
Results: We explore deep topological relationships between suffix trees and compressed de Bruijn graphs and introduce an algorithm, splitMEM, that directly constructs the compressed de Bruijn graph in time and space linear to the total number of genomes for a given maximum genome size. We introduce suffix skips to traverse several suffix links simultaneously and use them to efficiently decompose maximal exact matches into graph nodes. We demonstrate the utility of splitMEM by analyzing the nine-strain pan-genome of Bacillus anthracis and up to 62 strains of Escherichia coli, revealing their core-genome properties.
© The Author 2014. Published by Oxford University Press. All rights reserved. For Permissions, please e-mail: journals.permissions@oup.com.
Figures
References
-
- Bowe A, et al. Proceedings of the 12th International Conference on Algorithms in Bioinformatics, Ljubljana, Slovenia. Berlin, Heidelberg: Springer-Verlag; 2012. Succinct de bruijn graphs; pp. 225–235.
-
- Cazaux B, et al. From indexing data structures to de bruijn graphs. 2014. http://hal-lirmm.ccsd.cnrs.fr/lirmm-00950983.
-
- Chikhi R, et al. On the representation of de bruijn graphs. RECOMB. 2014;Vol. 8394:35–55.
-
- Gusfield D. Algorithms on Strings, Trees, and Sequences—Computer Science and Computational Biology. New York, NY: Cambridge University Press; 1997.
Publication types
MeSH terms
Grants and funding
LinkOut - more resources
Full Text Sources
Other Literature Sources
Molecular Biology Databases
