. 2015 Jan;81(2):765-73.
doi: 10.1128/AEM.03117-14. Epub 2014 Nov 14.

Ecological succession and viability of human-associated microbiota on restroom surfaces

Affiliations

Ecological succession and viability of human-associated microbiota on restroom surfaces

Sean M Gibbons et al. Appl Environ Microbiol. 2015 Jan.

Abstract

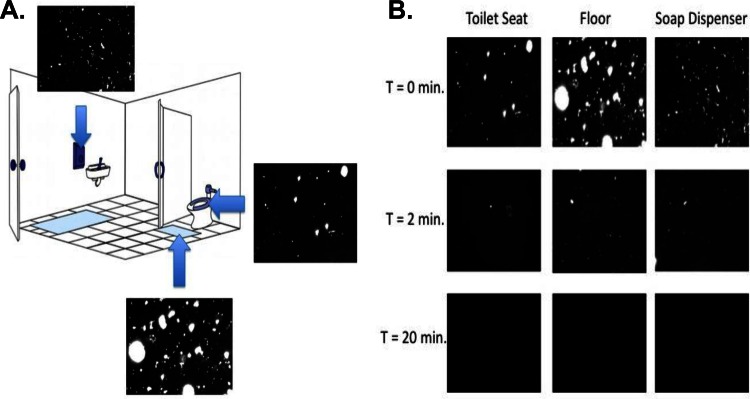
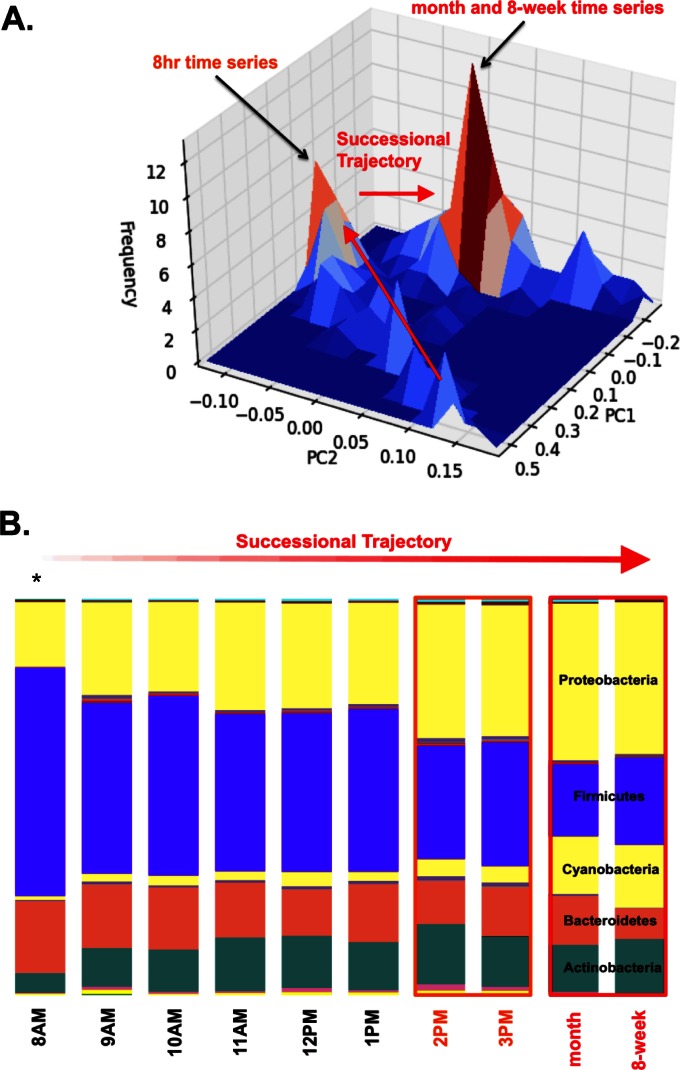
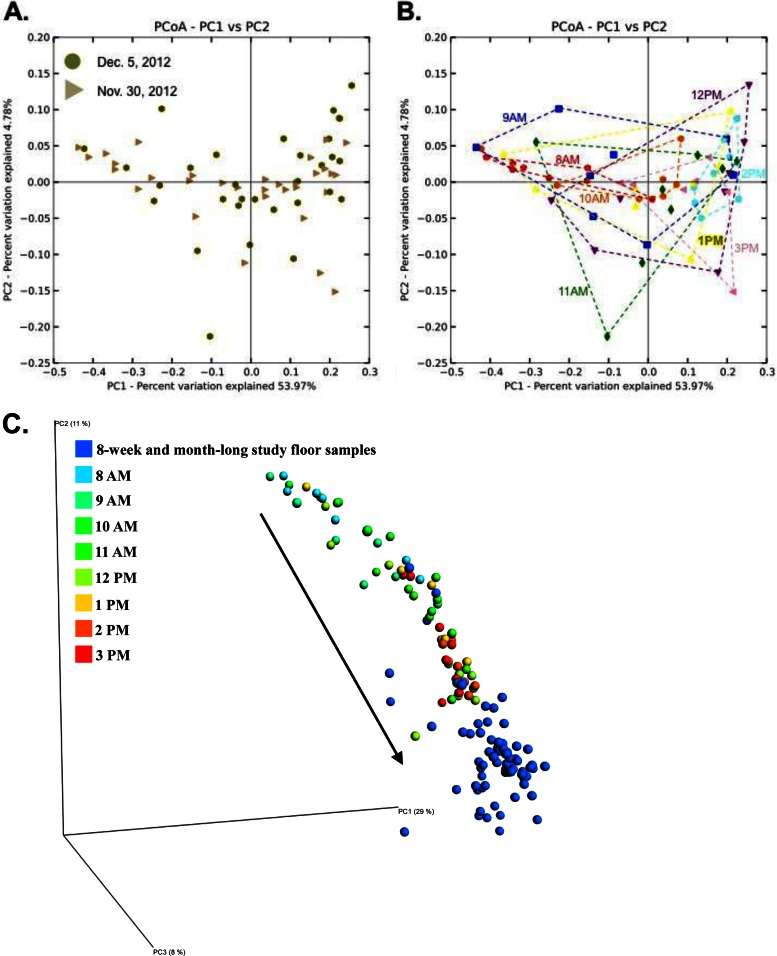
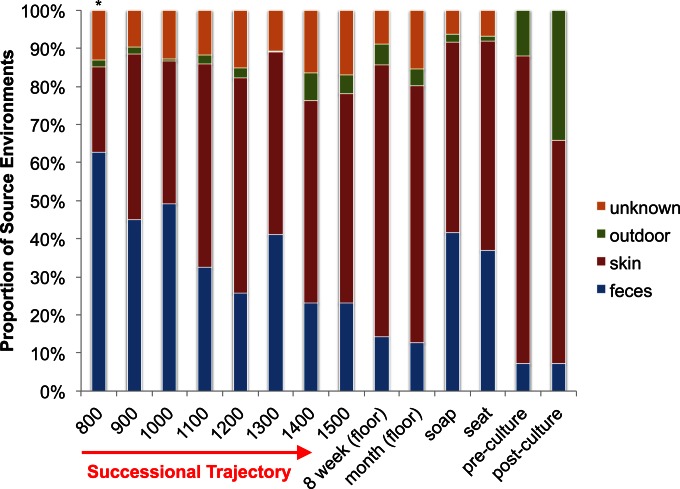
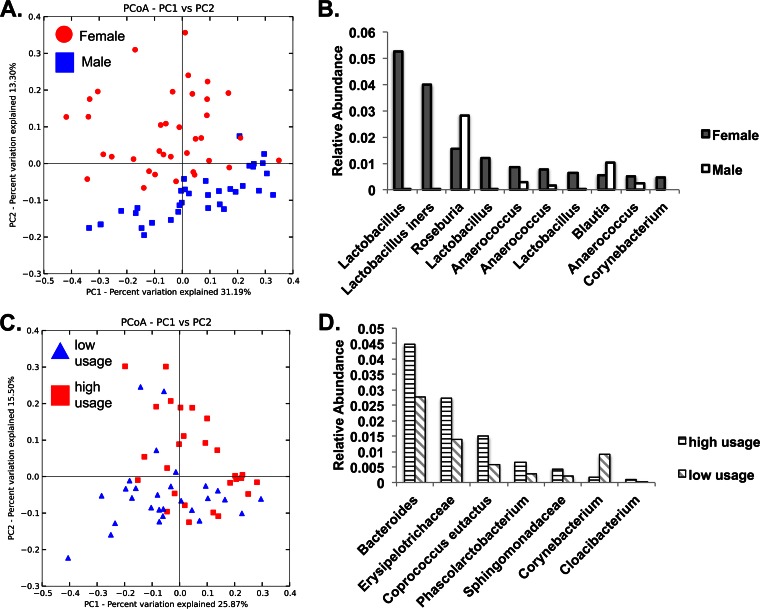
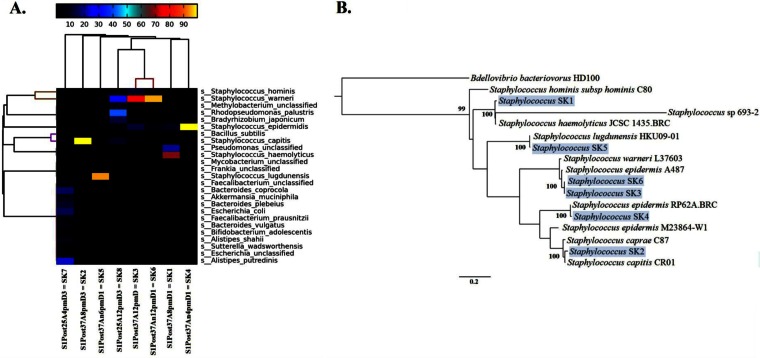
Human-associated bacteria dominate the built environment (BE). Following decontamination of floors, toilet seats, and soap dispensers in four public restrooms, in situ bacterial communities were characterized hourly, daily, and weekly to determine their successional ecology. The viability of cultivable bacteria, following the removal of dispersal agents (humans), was also assessed hourly. A late-successional community developed within 5 to 8 h on restroom floors and showed remarkable stability over weeks to months. Despite late-successional dominance by skin- and outdoor-associated bacteria, the most ubiquitous organisms were predominantly gut-associated taxa, which persisted following exclusion of humans. Staphylococcus represented the majority of the cultivable community, even after several hours of human exclusion. Methicillin-resistant Staphylococcus aureus (MRSA)-associated virulence genes were found on floors but were not present in assembled Staphylococcus pan-genomes. Viral abundances, which were predominantly enterophages, human papilloma virus, and herpesviruses, were significantly correlated with bacterial abundances and showed an unexpectedly low virus-to-bacterium ratio in surface-associated samples, suggesting that bacterial hosts are mostly dormant on BE surfaces.


Figures

FIG 1
FIG 1
(A) Samples were collected from three surfaces in both female and male restrooms at San Diego State University. The surfaces analyzed were the toilet seat, the floor in front of the toilet, and the soap dispenser pump. Epifluorescence microscopy confirmed that bacteria and virus-like particles (VLPs) are present on all three surfaces. (Restroom drawing modified from Flores et al. [4]). (B) Epifluorescence microscopy images show selected restroom surfaces that are DNA and RNA free after 20 min of treatment with 10% bleach; T is the length of time the surface was soaked in bleach.
FIG 2
FIG 2
(A) A 2D histogram of floor samples (including 8-h, 8-week, and month-long experiments) in principal coordinate space (weighted UniFrac). Peaks denote the areas within principal coordinate space where samples are found most frequently (regions of stability). The smaller peak corresponds to the later time points in the 8-h study. The larger peak shows the stable community state that remains relatively fixed in the 9-week and month-long samplings (corresponding to the community structures highlighted in red in panel B). We observed only early successional community composition in the 8-h time series. Over longer timescales, the community was consistently found in the late-successional state. (B) Composition of the microbial community along its successional trajectory. The asterisk above the 8 a.m. time point denotes the sample taken directly following rigorous decontamination of the floor surface with bleach. The orange and red boxes surrounding time points refer to the average community states characteristic of the two peaks (labeled with the corresponding colors [orange and red]) seen in panel A.
FIG 3
FIG 3
Principal coordinate (PCoA) plots of floor microbial communities over different timescales. (A) Replicate 8-h time series experiments cluster on top of one another. (B) Same plot as in panel A, but with samples colored by sample collection time point, and time point replicates encapsulated by convex hulls. (C) Samples from the 8-h experiment (rainbow colors) show a larger spread than samples taken from longer-term studies (8-week and 1-month with daily sampling; dark blue), showing that succession is rapid and occurs within 5 to 8 h. The black arrow in panel C shows the successional trajectory.
FIG 4
FIG 4
Relative proportions of OTUs derived from particular source environments (as determined using SourceTracker). The first eight samples represent the averages of replicate samples taken at each hour for the 8-h study. The 8-week and month bars represent the averages of all replicates for floor samples only. The soap and seat bars show the average of replicates for those surfaces across the 8-week and month-long studies. The pre- and postculture bars represent the averages from the human exclusion study (floor samples prior to culturing and after culturing). The asterisk above the 8 a.m. bar indicates that the floor was decontaminated prior to taking this sample. The source environment database was constructed using Earth Microbiome Project (EMP) data (closed reference OTUs; Greengenes release from May 2013). The outdoor category includes database samples from many outdoor environments: freshwater, freshwater microbial mat, freshwater sediment, bird nest, hot spring water, hot spring microbial mat, ice, marine biofilm, marine water, marine sediment, hypersaline water, sand, sandstone, and soil.
FIG 5
FIG 5
(A) PCoA (weighted UniFrac) shows a clear separation of toilet seat-associated microbial communities based on gender. (B) Top 10 most abundant OTUs that show significant differences in abundance between the toilet seats in male and female restrooms (most resolved taxonomic annotations are shown on the x axis). (C) Toilet seat samples cluster separately based on restroom usage frequency (high versus low). (D) Seven OTUs that exhibit significantly different abundances between high- and low-usage frequencies (most resolved taxonomic annotations are listed along the x axis).
FIG 6
FIG 6
Species-level metagenomic diversity from metagenomic assemblies of postculture swab samples from the human free study. (A) Species-level (SK1-SK8) relative abundance patterns across eight metagenomes, with hierarchical clustering of both rows and columns (average linkage clusters, using Bray-Curtis distance), reporting only the 25 most abundant species annotations (according to the 90th percentile of the abundances). The heatmap key shows percent relative abundance. (B) Rooted tree showing the phylogenetic positions of six Staphylococcus population genomes (shown on a light blue background), along with reference strains and Bdellovibrio bacteriovorus HD100 as the outgroup. The tree was constructed using PhyloPhlAn (29) with concatenated amino acid sequences from ∼400 conserved proteins. Values assigned to internal nodes within the phylogeny represent bootstrap support (bootstrap values of <0.50 are not reported). Bar, 0.2 changes per amino acid position.

References

    1. Custovic A, Taggart S, Woodcock A. 1994. House dust mite and cat allergen in different indoor environments. Clin Exp Allergy 24:1164. doi:10.1111/j.1365-2222.1994.tb03323.x. - DOI - PubMed
    1. Kelley ST, Gilbert JA. 2013. Studying the microbiology of the indoor environment. Genome Biol 14:202. doi:10.1186/gb-2013-14-2-202. - DOI - PMC - PubMed
    1. Kembel SW, Jones E, Kline J, Northcutt D, Stenson J, Womack AM, Bohannan BJ, Brown G, Green JL. 2012. Architectural design influences the diversity and structure of the built environment microbiome. ISME J 6:1469–1479. doi:10.1038/ismej.2011.211. - DOI - PMC - PubMed
    1. Flores GE, Bates ST, Knights D, Lauber CL, Stombaugh J, Knight R, Fierer N. 2011. Microbial biogeography of public restroom surfaces. PLoS One 6:e28132. doi:10.1371/journal.pone.0028132. - DOI - PMC - PubMed
    1. Rintala H, Pitkäranta M, Toivola M, Paulin L, Nevalainen A. 2008. Diversity and seasonal dynamics of bacterial community in indoor environment. BMC Microbiol 8:56. doi:10.1186/1471-2180-8-56. - DOI - PMC - PubMed

Publication types

Associated data