

Association between serum free fatty acid levels and possible related factors in patients with type 2 diabetes mellitus and acute myocardial infarction
- PMID: 25399059
- PMCID: PMC4236447
- DOI: 10.1186/1471-2261-14-159
Association between serum free fatty acid levels and possible related factors in patients with type 2 diabetes mellitus and acute myocardial infarction
Abstract
Background: Free fatty acids (FFAs) play importance roles in the development of diabetes and cardiovascular diseases. We measured serum FFA levels from type 2 diabetes mellitus (T2DM) and acute myocardial infarction (AMI) patients and assay the correlation between serum FFA levels and related factors. The present study was undertaken to investigate a possible relation between the changes in serum free fatty acid concentration with acute myocardial infarction and type 2 diabetes mellitus.
Methods: The study population consisted of 540 healthy individuals and 103 patients with T2DM, 59 patients with AMI and 21 volunteers. Serum FFAs were measured with high pressure liquid chromatography. Blood urea nitrogen and uric acid were measured in clinical laboratory, as were glycemic, lipid and blood routine parameters. We selected 242 individuals with age over 60 years, 143 healthy individuals and 52 patients with T2DM, 47 patients with AMI were incorporated into three groups as control group, T2DM group and AMI group. Associations were analyzed with stepwise regression analysis with adjusted for age, sex, body mass index.
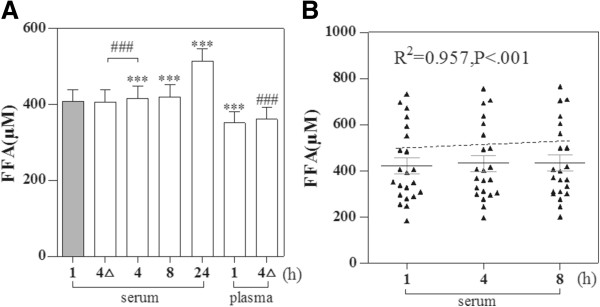
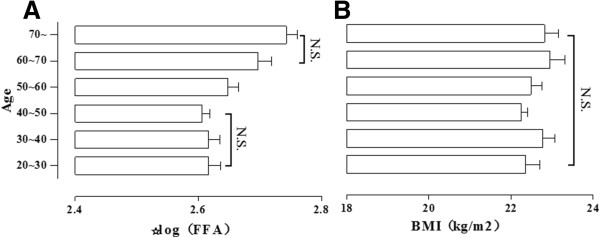
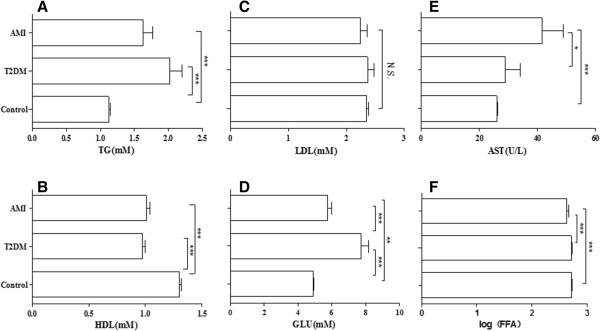
Results: Serum FFA levels were significantly higher in the age over 60 years individuals compared to 20 ~ 50 years (logFFA μmmol/L:2.60 ± 0.16 vs. 2.73 ± 0.18, P < .001) in the healthy group. We found lower FFA levels in the AMI compared to the T2DM and control group (2.64 ± 0.22 vs. 2.72 ± 0.13&2.72 ± 0.16, respectively, P < .05&P < 0.01) in the age over 60, fasting blood glucose level higher in the AMI and T2DM (5.78 ± 1.32&7.75 ± 2.93 mmol/L vs. 4.90 ± 0.47 mmol/L, P < .01&P < .001) compared with the normal group, HDL level (1.01 ± 0.22&0.98 ± 0.18 mmol/L vs.1.30 ± 0.22 mmol/L, P < .001&P < .001). With stepwise regression analysis, the serum FFA levels was positively associated with the HDL in the control group (YlogFFA = 2.32 + 0.33XHDL, R = 0.26, P < .01) and T2MD (YlogFFA = 2.46 + 0.27XHDL, R = 0.36, P < .05), AST in AMI (YlogFFA =2.24 + 0. 015XAST, R = 0.49, P < .01).
Conclusions: Compared to control group, serum FFA levels were decreased only in AMI group, while HDL level was increased in both AMI and T2DM group. The serum FFA levels were positive association with the HDL level in both T2DM and control group, FFA levels were positive association with AST in AMI.
Figures
Similar articles
-
[The characteristics of high density lipoprotein cholesterol and the relationship between high density lipoprotein cholesterol and the severity of coronary artery lesions in young men with acute myocardial infarction].Zhonghua Yi Xue Za Zhi. 2013 May 21;93(19):1458-62. Zhonghua Yi Xue Za Zhi. 2013. PMID: 24029567 Chinese.
-
Elevated Plasma Free Fatty Acid Susceptible to Early Cognitive Impairment in Type 2 Diabetes Mellitus.J Alzheimers Dis. 2021;82(3):1345-1356. doi: 10.3233/JAD-210403. J Alzheimers Dis. 2021. PMID: 34151809
-
Plasma levels of free fatty acids correlate with type 2 diabetes mellitus.Diabetes Obes Metab. 2018 Nov;20(11):2661-2669. doi: 10.1111/dom.13449. Epub 2018 Jul 30. Diabetes Obes Metab. 2018. PMID: 29943387
-
Unbound free fatty acids and heart-type fatty acid-binding protein: diagnostic assays and clinical applications.Clin Chem. 2006 Jan;52(1):19-29. doi: 10.1373/clinchem.2005.056143. Epub 2005 Nov 3. Clin Chem. 2006. PMID: 16269514 Review.
-
Research progress on the relationship between free fatty acid profile and type 2 diabetes complicated by coronary heart disease.Front Endocrinol (Lausanne). 2024 Dec 6;15:1503704. doi: 10.3389/fendo.2024.1503704. eCollection 2024. Front Endocrinol (Lausanne). 2024. PMID: 39713052 Free PMC article. Review.
Cited by
-
Non-Esterified Fatty Acids and Risks of Frailty, Disability, and Mobility Limitation in Older Adults: The Cardiovascular Health Study.J Am Geriatr Soc. 2020 Dec;68(12):2890-2897. doi: 10.1111/jgs.16793. Epub 2020 Sep 22. J Am Geriatr Soc. 2020. PMID: 32964434 Free PMC article.
-
Metabolome-Genome-Wide Association Study (mGWAS) Reveals Novel Metabolites Associated with Future Type 2 Diabetes Risk and Susceptibility Loci in a Case-Control Study in a Chinese Prospective Cohort.Glob Chall. 2021 Mar 23;5(4):2000088. doi: 10.1002/gch2.202000088. eCollection 2021 Apr. Glob Chall. 2021. PMID: 33854788 Free PMC article.
-
Non-esterified fatty acids and telomere length in older adults: The Cardiovascular Health Study.Metabol Open. 2020 Sep 7;8:100058. doi: 10.1016/j.metop.2020.100058. eCollection 2020 Dec. Metabol Open. 2020. PMID: 32995737 Free PMC article.
-
Nonesterified Fatty Acids and Hospitalizations Among Older Adults: The Cardiovascular Health Study.J Gerontol A Biol Sci Med Sci. 2021 Jun 14;76(7):1326-1332. doi: 10.1093/gerona/glaa228. J Gerontol A Biol Sci Med Sci. 2021. PMID: 32914181 Free PMC article.
-
Free fatty acids and cardiovascular outcome: a Chinese cohort study on stable coronary artery disease.Nutr Metab (Lond). 2017 Jun 26;14:41. doi: 10.1186/s12986-017-0195-1. eCollection 2017. Nutr Metab (Lond). 2017. PMID: 28674554 Free PMC article.
References
-
- Danaei G, Finucane MM, Lu Y, Singh GM, Cowan MJ, Paciorek CJ, Lin JK, Farzadfar F, Khang YH, Stevens GA, Rao M, Ali MK, Riley LM, Robinson CA, Ezzati M, Global Burden of Metabolic Risk Factors of Chronic Diseases Collaborating Group (Blood Glucose) National, regional, and global trends in fasting plasma glucose and diabetes prevalence since 1980: systematic analysis of health examination surveys and epidemiological studies with 370 country-years and 2.7 million participants. Lancet. 2011;31(9785):31–40. doi: 10.1016/S0140-6736(11)60679-X. - DOI - PubMed
-
- Mas S, Martinez-Pinna R, Martin-Ventura JL, Perez R, Gomez-Garre D, Ortiz A, Fernandez-Cruz A, Vivanco F, Egido J. Local non-esterified fatty acids correlate with inflammation in atheroma plaques of patients with type 2 diabetes. Diabetes. 2010;59(6):1292–1301. doi: 10.2337/db09-0848. - DOI - PMC - PubMed
Pre-publication history
-
- The pre-publication history for this paper can be accessed here:http://www.biomedcentral.com/1471-2261/14/159/prepub
Publication types
MeSH terms
Substances
LinkOut - more resources
Full Text Sources
Other Literature Sources
Medical
