. 2015 Jan;43(Database issue):D240-9.
doi: 10.1093/nar/gku1158. Epub 2014 Nov 15.

The OMA orthology database in 2015: function predictions, better plant support, synteny view and other improvements

Affiliations

The OMA orthology database in 2015: function predictions, better plant support, synteny view and other improvements

Adrian M Altenhoff et al. Nucleic Acids Res. 2015 Jan.

Abstract

The Orthologous Matrix (OMA) project is a method and associated database inferring evolutionary relationships amongst currently 1706 complete proteomes (i.e. the protein sequence associated for every protein-coding gene in all genomes). In this update article, we present six major new developments in OMA: (i) a new web interface; (ii) Gene Ontology function predictions as part of the OMA pipeline; (iii) better support for plant genomes and in particular homeologs in the wheat genome; (iv) a new synteny viewer providing the genomic context of orthologs; (v) statically computed hierarchical orthologous groups subsets downloadable in OrthoXML format; and (vi) possibility to export parts of the all-against-all computations and to combine them with custom data for 'client-side' orthology prediction. OMA can be accessed through the OMA Browser and various programmatic interfaces at http://omabrowser.org.


Figures

Figure 1.
Figure 1.
User-centric new design. The website has been redesigned with an emphasis on usability.
Figure 2.
Figure 2.
Gene Ontology propagation in the OMA pipeline. New Gene Ontology (GO) annotations for the sparsely annotated Arabidopsis thaliana protein Q8VYZ5 are inferred by propagating annotations from other members of the OMA group, taking into account implied parental terms and lineage-specific terms (see main text). For example, the inferred biological process Gene Ontology (GO) term ‘post-embryonic development’ is based on the more specific GO term ‘nematode larval development’; the latter is in itself inappropriate to assign to a protein in the plant clade. Proteins are labelled with their SwissProt/UniProt identifiers. The abbreviations ARATH, CAEEL, SCHIPO, DROME, HUMAN and YEAST refer to species Arabidopsis thaliana, Caenorhabditis elegans, Schizosaccharomyces pombe, Drosophila melanogaster, Homo sapiens and Saccharomyces cerevisiae, respectively.
Figure 3.
Figure 3.
Numbers of electronic Gene Ontology annotations in the OMA database. Three major sources of electronic annotations are shown: annotations through the association of InterPro records with GO terms, annotations based on UniProtKB keyword mappings and annotations inferred in the OMA pipeline. The intersections show the numbers of annotations in common amongst the resources.
Figure 4.
Figure 4.
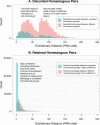
Distribution of evolutionary distances for homeologous pairs that were (A) discarded via witness of non-homeology or because they were outliers, or (B) retained as inferred homeologs. In both plots, the blue colour represents pairs where both homeologs are located on the same chromosome group and the red colour indicates pairs where homeologs are located on different chromosome groups. The y-axes are drawn at different scales but the grid is consistent across the two plots.
Figure 5.
Figure 5.
Screenshot of the new OMA synteny viewer with the ADH1A gene in human (Gene ID 22168) as query. Each gene is illustrated as a box containing a numerical OMA Gene ID and an arrow to indicate the gene's orientation. The colour of genes outside the query species indicates orthologous relationship with human genes, with bands of colour capturing many-to-one and many-to-many relationships. Genes that are non-orthologous to all nine human genes contained in this window are displayed in grey. The fragmented assemblies of tarsier (TARSY) and mouse lemur (MICMU) contain no genes next to 03287 and 02276, respectively.
Figure 6.
Figure 6.
Gene losses, duplications and gains from hierarchical orthologous groups. Gene duplications, losses and gains on the primate lineage inferred from OMA hierarchical orthologous groups.
Figure 7.
Figure 7.
Selection tool for pre-computed genome export. This new function enables users to export genomes of interest and their associated all-against-all comparisons for analysis in the OMA standalone software.

References

    1. Fitch W.M. Distinguishing homologous from analogous proteins. Syst. Zool. 1970;19:99–113. - PubMed
    1. Sonnhammer E.L.L., Koonin E.V. Orthology, paralogy and proposed classification for paralog subtypes. Trends Genet. 2002;18:619–620. - PubMed
    1. Gabaldón T., Koonin E.V. Functional and evolutionary implications of gene orthology. Nat. Rev. Genet. 2013;14:360–366. - PMC - PubMed
    1. Sonnhammer E.L.L., Gabaldón T., Sousa da Silva A.W., Martin M., Robinson-Rechavi M., Boeckmann B., Thomas P.D., Dessimoz C., the Quest for Orthologs consortium Big data and other challenges in the quest for orthologs. Bioinformatics. 2014;30:2993–2998. - PMC - PubMed
    1. Altenhoff A.M., Dessimoz C. Inferring orthology and paralogy. In: Anisimova M, editor. Evolutionary Genomics. Methods in Molecular Biology. Vol. 855. Clifton, NJ: Humana Press; 2012. pp. 259–279. - PubMed

Publication types