

Blood pressure in early autosomal dominant polycystic kidney disease
- PMID: 25399733
- PMCID: PMC4343258
- DOI: 10.1056/NEJMoa1402685
Blood pressure in early autosomal dominant polycystic kidney disease
Abstract
Background: Hypertension is common in autosomal dominant polycystic kidney disease (ADPKD) and is associated with increased total kidney volume, activation of the renin-angiotensin-aldosterone system, and progression of kidney disease.
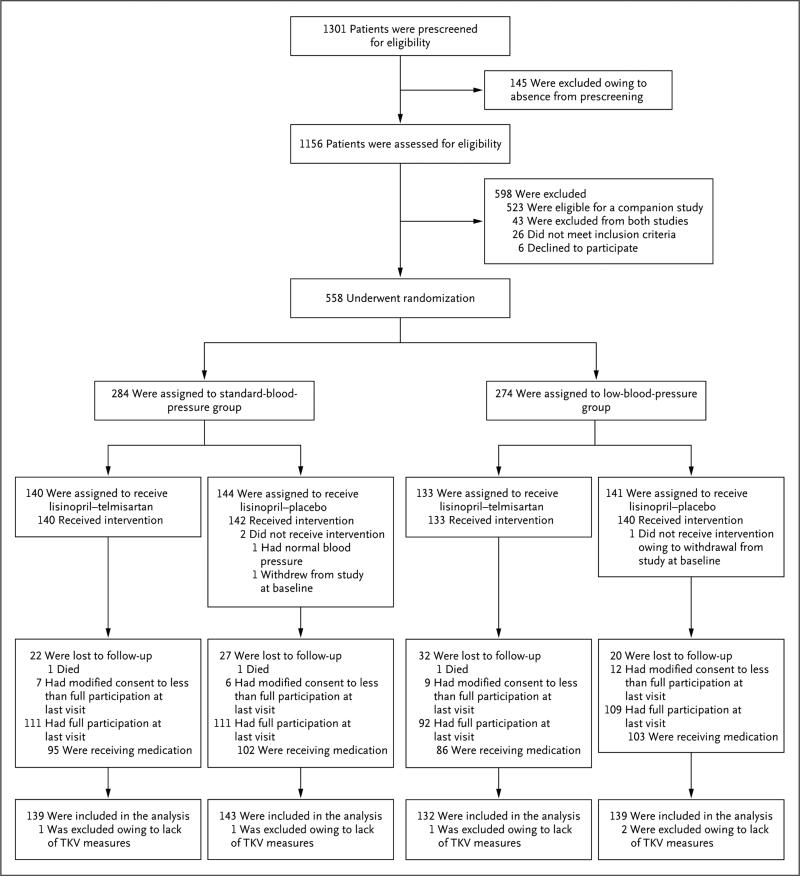
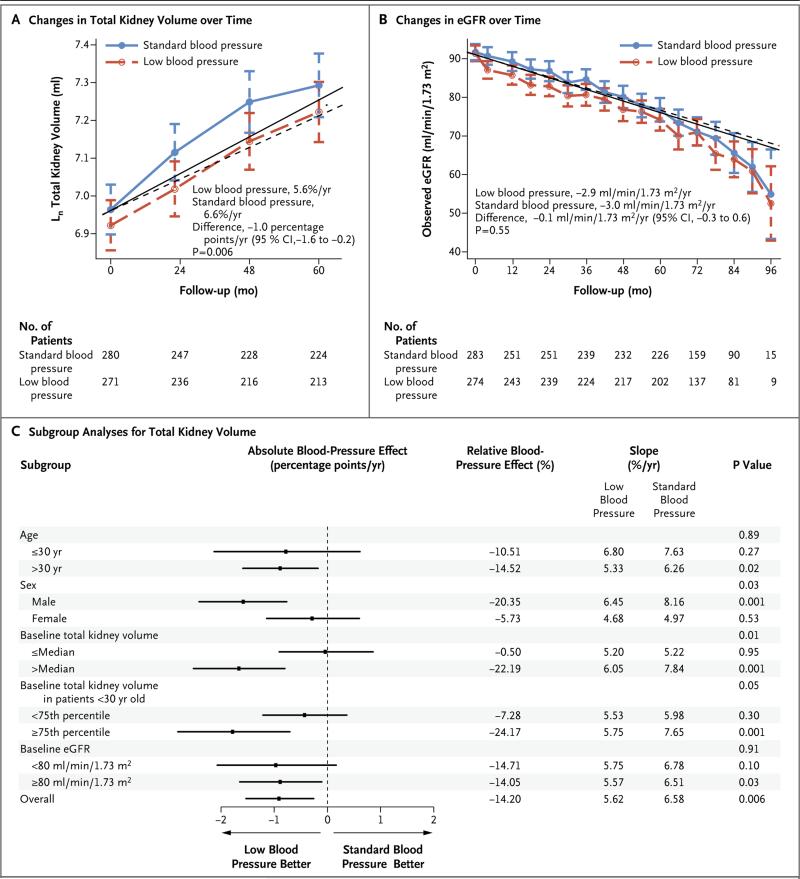
Methods: In this double-blind, placebo-controlled trial, we randomly assigned 558 hypertensive participants with ADPKD (15 to 49 years of age, with an estimated glomerular filtration rate [GFR] >60 ml per minute per 1.73 m(2) of body-surface area) to either a standard blood-pressure target (120/70 to 130/80 mm Hg) or a low blood-pressure target (95/60 to 110/75 mm Hg) and to either an angiotensin-converting-enzyme inhibitor (lisinopril) plus an angiotensin-receptor blocker (telmisartan) or lisinopril plus placebo. The primary outcome was the annual percentage change in the total kidney volume.
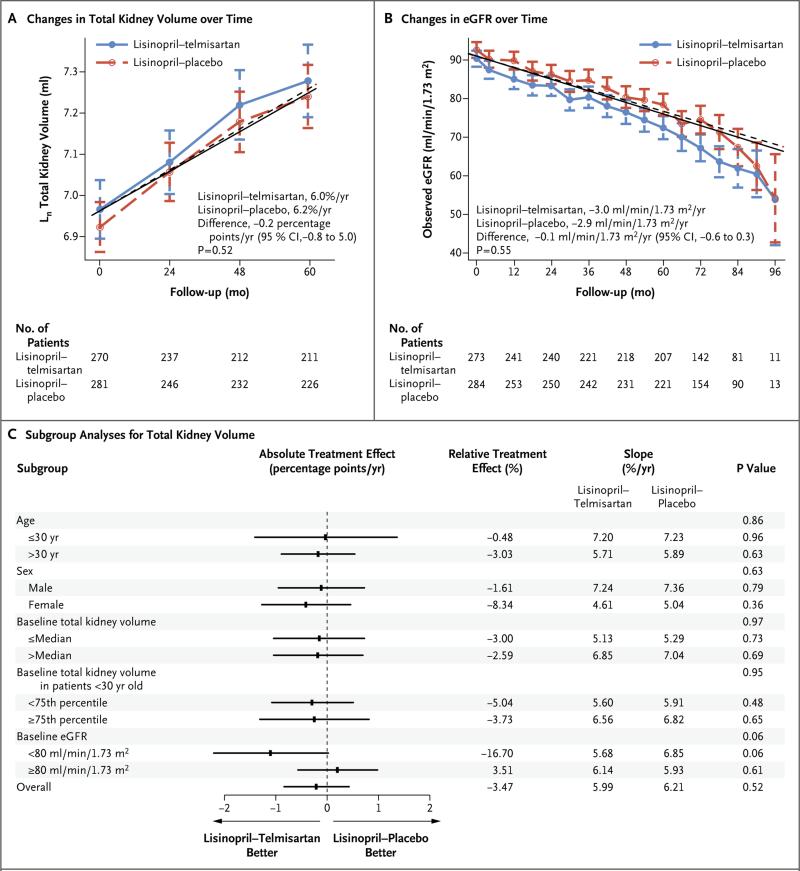
Results: The annual percentage increase in total kidney volume was significantly lower in the low-blood-pressure group than in the standard-blood-pressure group (5.6% vs. 6.6%, P=0.006), without significant differences between the lisinopril-telmisartan group and the lisinopril-placebo group. The rate of change in estimated GFR was similar in the two medication groups, with a negative slope difference in the short term in the low-blood-pressure group as compared with the standard-blood-pressure group (P<0.001) and a marginally positive slope difference in the long term (P=0.05). The left-ventricular-mass index decreased more in the low-blood-pressure group than in the standard-blood-pressure group (-1.17 vs. -0.57 g per square meter per year, P<0.001); urinary albumin excretion was reduced by 3.77% with the low-pressure target and increased by 2.43% with the standard target (P<0.001). Dizziness and light-headedness were more common in the low-blood-pressure group than in the standard-blood-pressure group (80.7% vs. 69.4%, P=0.002).
Conclusions: In early ADPKD, the combination of lisinopril and telmisartan did not significantly alter the rate of increase in total kidney volume. As compared with standard blood-pressure control, rigorous blood-pressure control was associated with a slower increase in total kidney volume, no overall change in the estimated GFR, a greater decline in the left-ventricular-mass index, and greater reduction in urinary albumin excretion. (Funded by the National Institute of Diabetes and Digestive and Kidney Diseases and others; HALT-PKD [Study A] ClinicalTrials.gov number, NCT00283686.).
Figures
Comment in
-
A quest--halting the progression of autosomal dominant polycystic kidney disease.N Engl J Med. 2014 Dec 11;371(24):2329-31. doi: 10.1056/NEJMe1412586. Epub 2014 Nov 15. N Engl J Med. 2014. PMID: 25399732 No abstract available.
-
Blood pressure in early autosomal dominant polycystic kidney disease.N Engl J Med. 2015 Mar 5;372(10):976-7. doi: 10.1056/NEJMc1500332. N Engl J Med. 2015. PMID: 25738676 No abstract available.
-
Blood pressure in early autosomal dominant polycystic kidney disease.N Engl J Med. 2015 Mar 5;372(10):975. doi: 10.1056/NEJMc1500332. N Engl J Med. 2015. PMID: 25738677 No abstract available.
-
Blood pressure in early autosomal dominant polycystic kidney disease.N Engl J Med. 2015 Mar 5;372(10):975-6. doi: 10.1056/NEJMc1500332. N Engl J Med. 2015. PMID: 25738678 No abstract available.
-
Blood pressure in early autosomal dominant polycystic kidney disease.N Engl J Med. 2015 Mar 5;372(10):976. doi: 10.1056/NEJMc1500332. N Engl J Med. 2015. PMID: 25738679 No abstract available.
References
Publication types
MeSH terms
Substances
Associated data
Grants and funding
- U01 DK062401/DK/NIDDK NIH HHS/United States
- TR001064/TR/NCATS NIH HHS/United States
- U01 DK062402/DK/NIDDK NIH HHS/United States
- TR001102/TR/NCATS NIH HHS/United States
- UL1 TR000001/TR/NCATS NIH HHS/United States
- M01 RR001032/RR/NCRR NIH HHS/United States
- RR000585/RR/NCRR NIH HHS/United States
- UL1 TR000454/TR/NCATS NIH HHS/United States
- RR025752/RR/NCRR NIH HHS/United States
- M01 RR000585/RR/NCRR NIH HHS/United States
- UL1 RR024989/RR/NCRR NIH HHS/United States
- DK62401/DK/NIDDK NIH HHS/United States
- UL1 RR025780/RR/NCRR NIH HHS/United States
- DK62410/DK/NIDDK NIH HHS/United States
- UL1 TR001064/TR/NCATS NIH HHS/United States
- RR033179/RR/NCRR NIH HHS/United States
- UL1 RR025752/RR/NCRR NIH HHS/United States
- M01 RR000039/RR/NCRR NIH HHS/United States
- UL1 RR033179/RR/NCRR NIH HHS/United States
- DK62402/DK/NIDDK NIH HHS/United States
- P01 DK034039/DK/NIDDK NIH HHS/United States
- TR000001/TR/NCATS NIH HHS/United States
- TR00135/TR/NCATS NIH HHS/United States
- M01 RR000054/RR/NCRR NIH HHS/United States
- M01 RR023940/RR/NCRR NIH HHS/United States
- RR024989/RR/NCRR NIH HHS/United States
- UL1 TR000135/TR/NCATS NIH HHS/United States
- DK62408/DK/NIDDK NIH HHS/United States
- RR000054/RR/NCRR NIH HHS/United States
- UL1 TR000439/TR/NCATS NIH HHS/United States
- U01 DK062408/DK/NIDDK NIH HHS/United States
- RR025758/RR/NCRR NIH HHS/United States
- TR001082/TR/NCATS NIH HHS/United States
- M01 RR000051/RR/NCRR NIH HHS/United States
- RR001032/RR/NCRR NIH HHS/United States
- TR000454/TR/NCATS NIH HHS/United States
- U01 DK062411/DK/NIDDK NIH HHS/United States
- UL1 TR001082/TR/NCATS NIH HHS/United States
- UL1 TR001102/TR/NCATS NIH HHS/United States
- RR023940/RR/NCRR NIH HHS/United States
- U01 DK082230/DK/NIDDK NIH HHS/United States
- UL1 RR024150/RR/NCRR NIH HHS/United States
- RR000039/RR/NCRR NIH HHS/United States
- UL1 RR025758/RR/NCRR NIH HHS/United States
- DK082230/DK/NIDDK NIH HHS/United States
- RR024150/RR/NCRR NIH HHS/United States
- UL1 RR025008/RR/NCRR NIH HHS/United States
- RR025780/RR/NCRR NIH HHS/United States
- TR000439/TR/NCATS NIH HHS/United States
- DK62411/DK/NIDDK NIH HHS/United States
- U01 DK062410/DK/NIDDK NIH HHS/United States
- RR025008/RR/NCRR NIH HHS/United States
- RR000051/RR/NCRR NIH HHS/United States
LinkOut - more resources
Full Text Sources
Other Literature Sources
Medical
Research Materials